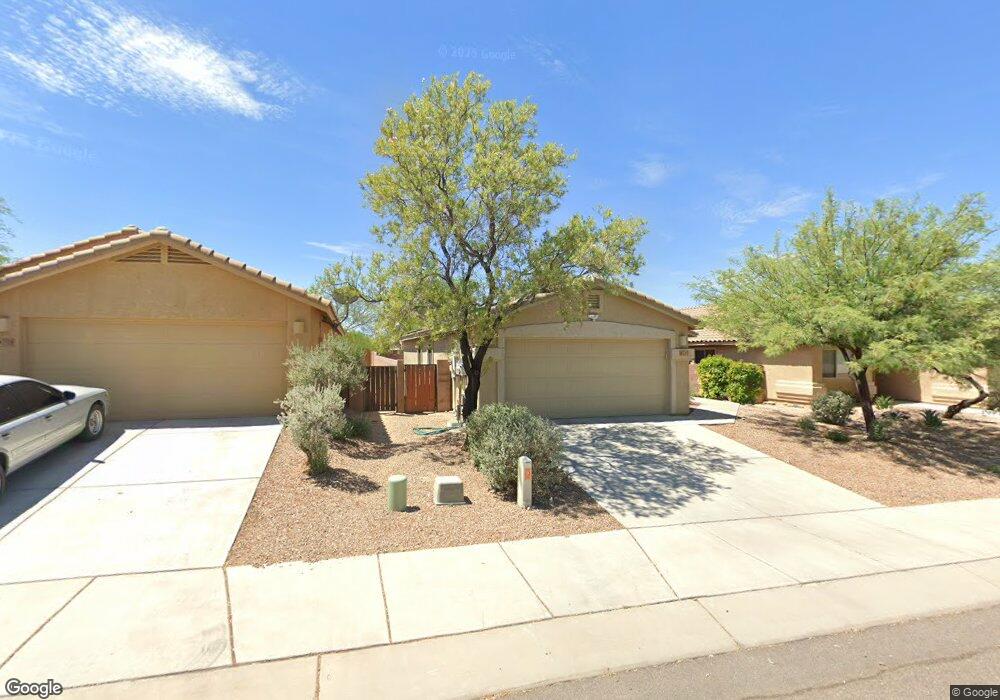
7310 E Laughing Tree Ln Tucson, AZ 85756
Estimated Value: $288,000 - $314,000
3
Beds
2
Baths
1,385
Sq Ft
$215/Sq Ft
Est. Value
About This Home
This home is located at 7310 E Laughing Tree Ln, Tucson, AZ 85756 and is currently estimated at $298,465, approximately $215 per square foot. 7310 E Laughing Tree Ln is a home located in Pima County with nearby schools including Vail Academy and High School, Desert Willow Elementary School, and Rincon Vista Middle School.
Ownership History
Date
Name
Owned For
Owner Type
Purchase Details
Closed on
Aug 19, 2020
Sold by
Miller Mathew D and Miller Sarah M
Bought by
Miller John P and Miller Gayle J
Current Estimated Value
Purchase Details
Closed on
May 16, 2011
Sold by
Taylor Darron and Taylor Kelly
Bought by
Miller Matthew D and Miller Sarah M
Home Financials for this Owner
Home Financials are based on the most recent Mortgage that was taken out on this home.
Original Mortgage
$95,495
Interest Rate
4.84%
Mortgage Type
FHA
Purchase Details
Closed on
May 1, 2007
Sold by
Title Security Agency Of Arizona
Bought by
Taylor Darron and Taylor Kelly
Home Financials for this Owner
Home Financials are based on the most recent Mortgage that was taken out on this home.
Original Mortgage
$184,919
Interest Rate
6.15%
Mortgage Type
VA
Create a Home Valuation Report for This Property
The Home Valuation Report is an in-depth analysis detailing your home's value as well as a comparison with similar homes in the area
Purchase History
| Date | Buyer | Sale Price | Title Company |
|---|---|---|---|
| Miller John P | $207,000 | Pioneer Title Agency Inc | |
| Miller John P | $207,000 | Pioneer Title Agency Inc | |
| Miller Matthew D | $98,000 | Ttise | |
| Taylor Darron | $180,585 | Ttise |
Source: Public Records
Mortgage History
| Date | Status | Borrower | Loan Amount |
|---|---|---|---|
| Previous Owner | Miller Matthew D | $95,495 | |
| Previous Owner | Taylor Darron | $184,919 |
Source: Public Records
Tax History
| Year | Tax Paid | Tax Assessment Tax Assessment Total Assessment is a certain percentage of the fair market value that is determined by local assessors to be the total taxable value of land and additions on the property. | Land | Improvement |
|---|---|---|---|---|
| 2026 | $2,664 | $19,746 | -- | -- |
| 2025 | $2,664 | $18,806 | -- | -- |
| 2024 | $2,254 | $17,911 | -- | -- |
| 2023 | $2,219 | $17,058 | $0 | $0 |
| 2022 | $2,212 | $16,245 | $0 | $0 |
| 2021 | $2,245 | $14,735 | $0 | $0 |
| 2020 | $2,190 | $14,735 | $0 | $0 |
| 2019 | $2,167 | $15,055 | $0 | $0 |
| 2018 | $2,010 | $12,729 | $0 | $0 |
| 2017 | $1,962 | $12,729 | $0 | $0 |
| 2016 | $1,996 | $13,201 | $0 | $0 |
| 2015 | $1,941 | $12,736 | $0 | $0 |
Source: Public Records
Map
Nearby Homes
- 7340 E Alderberry St
- 7287 E Heartwood Dr
- 7455 E Fair Meadows Loop
- 7471 E Sycamore Park Blvd
- 7500 E Voyager Rd Unit 137
- 7500 E Voyager Rd Unit 138
- 7500 E Voyager Rd Unit 135
- 7500 E Voyager Rd Unit 5
- 8701 S Kolb Rd Unit 2-270
- 8701 S Kolb Rd Unit 7-311
- 8701 S Kolb Rd Unit 10-184
- 8701 S Kolb Rd Unit 4-199
- 8701 S Kolb Rd Unit 1-279
- 8701 S Kolb Rd Unit 9-330
- 8701 S Kolb Rd Unit 9-320
- 8701 S Kolb Rd Unit 7-234
- 8701 S Kolb Rd Unit 18-199
- 8701 S Kolb Rd Unit 11-316
- 8701 S Kolb Rd Unit 11-327
- 8701 S Kolb Rd Unit 11-317
- 7318 E Laughing Tree Ln
- 7304 E Laughing Tree Ln
- 7324 E Laughing Tree Ln
- 7296 E Laughing Tree Ln
- 7311 E Weeping Willow Dr
- 7319 E Weeping Willow Dr
- 7305 E Weeping Willow Dr
- 7332 E Laughing Tree Ln
- 7290 E Laughing Tree Ln
- 7325 E Weeping Willow Dr
- 7297 E Weeping Willow Dr
- 7309 E Laughing Tree Ln
- 7317 E Laughing Tree Ln
- 7303 E Laughing Tree Ln
- 7333 E Weeping Willow Dr
- 7289 E Weeping Willow Dr
- 7338 E Laughing Tree Ln
- 7284 E Laughing Tree Ln
- 7323 E Laughing Tree Ln
- 7295 E Laughing Tree Ln
Your Personal Tour Guide
Ask me questions while you tour the home.