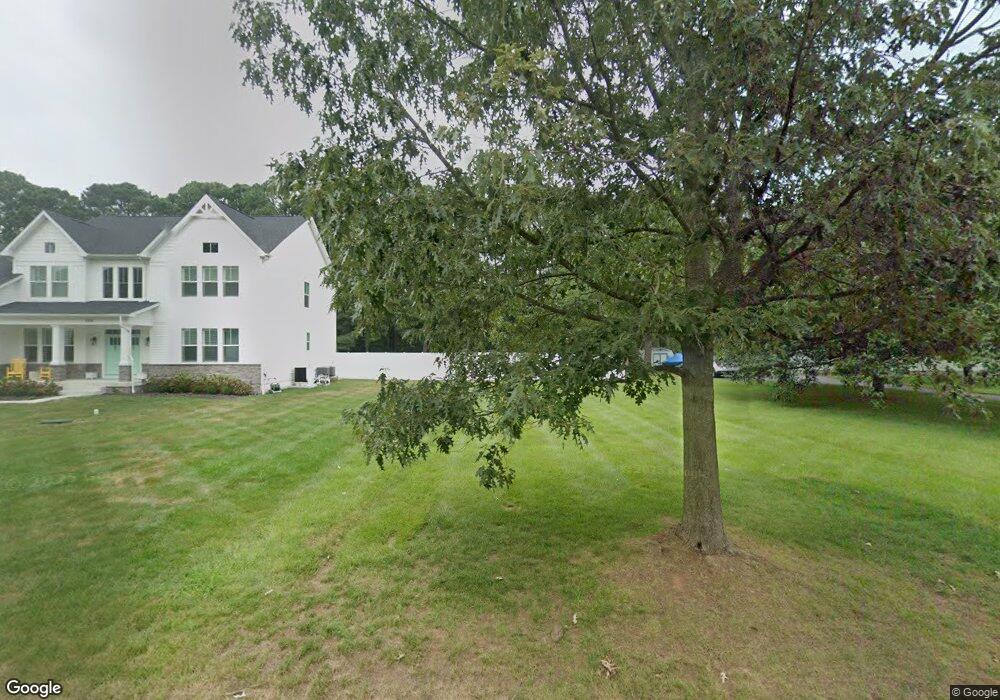
7310 Station Rd Newcomb, MD 21653
Estimated Value: $576,000 - $1,035,000
Studio
1
Bath
3,662
Sq Ft
$216/Sq Ft
Est. Value
About This Home
This home is located at 7310 Station Rd, Newcomb, MD 21653 and is currently estimated at $791,036, approximately $216 per square foot. 7310 Station Rd is a home with nearby schools including St. Michaels Elementary School, St. Michaels Middle/High School, and Easton High School.
Ownership History
Date
Name
Owned For
Owner Type
Purchase Details
Closed on
Jul 27, 2021
Sold by
Smith Jeffrey
Bought by
Kiley Patrick and Kiley Colleen
Current Estimated Value
Home Financials for this Owner
Home Financials are based on the most recent Mortgage that was taken out on this home.
Original Mortgage
$793,248
Outstanding Balance
$726,265
Interest Rate
3.37%
Mortgage Type
Construction
Estimated Equity
$64,771
Purchase Details
Closed on
Jun 18, 2012
Sold by
Talbot County
Bought by
Smith Jeffrey
Purchase Details
Closed on
Sep 6, 2005
Sold by
Gifford Barbara G
Bought by
Smith Jeffrey
Home Financials for this Owner
Home Financials are based on the most recent Mortgage that was taken out on this home.
Original Mortgage
$139,500
Interest Rate
6.62%
Mortgage Type
Adjustable Rate Mortgage/ARM
Purchase Details
Closed on
May 28, 2002
Sold by
Smith Thomas C
Bought by
Gifford Barbara G
Purchase Details
Closed on
Nov 28, 2001
Sold by
Simmons James O
Bought by
Smith Thomas C
Create a Home Valuation Report for This Property
The Home Valuation Report is an in-depth analysis detailing your home's value as well as a comparison with similar homes in the area
Purchase History
| Date | Buyer | Sale Price | Title Company |
|---|---|---|---|
| Kiley Patrick | $160,000 | Eagle Title Llc | |
| Smith Jeffrey | -- | None Available | |
| Smith Jeffrey | $155,000 | -- | |
| Gifford Barbara G | $75,000 | -- | |
| Smith Thomas C | $58,500 | -- |
Source: Public Records
Mortgage History
| Date | Status | Borrower | Loan Amount |
|---|---|---|---|
| Open | Kiley Patrick | $793,248 | |
| Previous Owner | Smith Jeffrey | $139,500 |
Source: Public Records
Tax History
| Year | Tax Paid | Tax Assessment Tax Assessment Total Assessment is a certain percentage of the fair market value that is determined by local assessors to be the total taxable value of land and additions on the property. | Land | Improvement |
|---|---|---|---|---|
| 2025 | $6,432 | $709,000 | $138,100 | $570,900 |
| 2024 | $6,346 | $709,000 | $138,100 | $570,900 |
| 2023 | $6,012 | $709,000 | $138,100 | $570,900 |
| 2022 | $850 | $108,100 | $108,100 | $0 |
| 2021 | $803 | $105,333 | $0 | $0 |
| 2020 | $769 | $102,667 | $0 | $0 |
| 2019 | $743 | $100,000 | $100,000 | $0 |
| 2018 | $712 | $100,000 | $100,000 | $0 |
| 2017 | $659 | $100,000 | $0 | $0 |
| 2016 | $643 | $100,000 | $0 | $0 |
| 2015 | $822 | $100,000 | $0 | $0 |
| 2014 | $822 | $100,000 | $0 | $0 |
Source: Public Records
Map
Nearby Homes
- 0 St Michaels Rd Unit MDTA2012442
- 7375 Station Rd
- 7049 & 7047 Acorn Aly
- 26396 St Michaels Rd
- 6827 Bellevue Rd
- 7605 Pendleton Farm Ln
- 25711 Royal Rd
- 26698 Arcadia Shores Rd
- 25706 Edgeview Rd
- 100 Bush Terrace
- 1215 Washington Dr
- 1211 Washington Dr
- 24977 Back Creek Dr
- 601 Cove Rd
- 24912 Back Creek Dr
- Lot 5 Travelers Rest Rd
- 228 Tyler Ave
- 8515 Deep Cove Rd
- 926 Calvert Ave
- 912 Calvert Ave
- 7423 Station Rd
- 7399 Back St
- 25911 River Rd
- 7370 Station Rd
- 7327 Woodside Rd
- 7387 Station Rd
- 7416 Station Rd
- 25922 River Rd
- 7414 Back St
- 7423 Station Rd
- 7414 Station Rd
- 7415 Station Rd
- 7405 Back St
- 7409 Back St
- 7399 Back St
- 7396 Back St
- 7412 Station Rd
- 7395 Back St
- 26256 Miles View Rd Unit 3B
- 26256 Miles View Rd Unit 1A
Your Personal Tour Guide
Ask me questions while you tour the home.