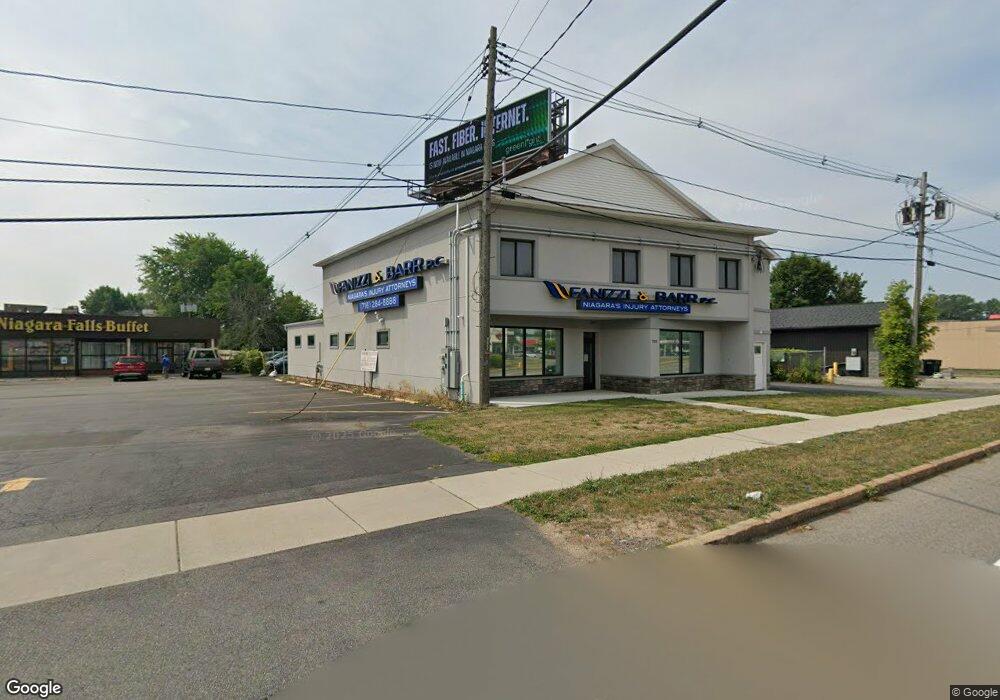
7311 Niagara Falls Blvd Niagara Falls, NY 14304
LaSalle NeighborhoodEstimated Value: $694,097
--
Bed
--
Bath
7,468
Sq Ft
$93/Sq Ft
Est. Value
About This Home
This home is located at 7311 Niagara Falls Blvd, Niagara Falls, NY 14304 and is currently estimated at $694,097, approximately $92 per square foot. 7311 Niagara Falls Blvd is a home located in Niagara County with nearby schools including Niagara Falls High School, Catholic Academy Of Niagara Falls - Elementary, and Christ the King Preparatory Academy.
Ownership History
Date
Name
Owned For
Owner Type
Purchase Details
Closed on
Aug 21, 2014
Sold by
Kanam Goldy Llc
Bought by
7311Nfb Llc
Current Estimated Value
Home Financials for this Owner
Home Financials are based on the most recent Mortgage that was taken out on this home.
Original Mortgage
$234,000
Outstanding Balance
$178,624
Interest Rate
4.14%
Mortgage Type
Commercial
Estimated Equity
$515,473
Purchase Details
Closed on
Aug 6, 2007
Sold by
Bakota Stephanie Estate
Bought by
R & W Of Niagara Falls
Create a Home Valuation Report for This Property
The Home Valuation Report is an in-depth analysis detailing your home's value as well as a comparison with similar homes in the area
Home Values in the Area
Average Home Value in this Area
Purchase History
| Date | Buyer | Sale Price | Title Company |
|---|---|---|---|
| 7311Nfb Llc | $292,400 | None Available | |
| R & W Of Niagara Falls | -- | -- |
Source: Public Records
Mortgage History
| Date | Status | Borrower | Loan Amount |
|---|---|---|---|
| Open | 7311Nfb Llc | $234,000 |
Source: Public Records
Tax History Compared to Growth
Tax History
| Year | Tax Paid | Tax Assessment Tax Assessment Total Assessment is a certain percentage of the fair market value that is determined by local assessors to be the total taxable value of land and additions on the property. | Land | Improvement |
|---|---|---|---|---|
| 2024 | $12,709 | $261,500 | $44,900 | $216,600 |
| 2023 | $12,709 | $243,500 | $44,900 | $198,600 |
| 2022 | $5,324 | $182,000 | $44,900 | $137,100 |
| 2021 | $5,323 | $182,000 | $44,900 | $137,100 |
| 2020 | $3,532 | $182,000 | $44,900 | $137,100 |
| 2019 | $3,726 | $182,000 | $44,900 | $137,100 |
| 2018 | $5,747 | $200,000 | $44,900 | $155,100 |
| 2017 | $3,726 | $200,000 | $44,900 | $155,100 |
| 2016 | $7,044 | $200,000 | $44,900 | $155,100 |
| 2015 | -- | $200,000 | $44,900 | $155,100 |
| 2014 | -- | $200,000 | $44,900 | $155,100 |
Source: Public Records
Map
Nearby Homes