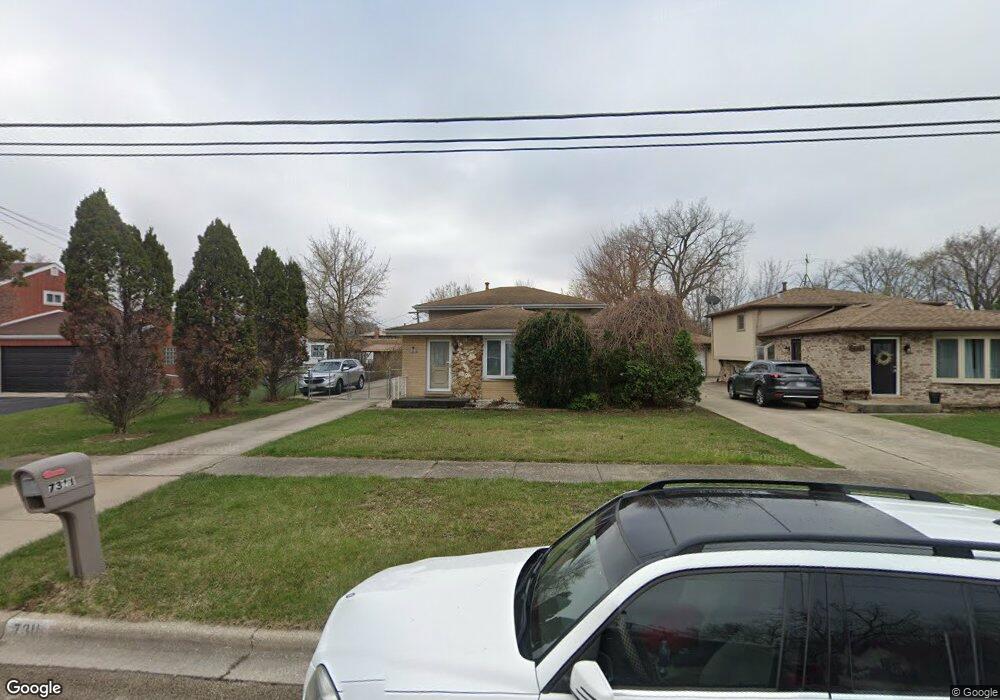
7311 W 74th St Bridgeview, IL 60455
Estimated Value: $359,979 - $420,000
3
Beds
2
Baths
1,149
Sq Ft
$334/Sq Ft
Est. Value
About This Home
This home is located at 7311 W 74th St, Bridgeview, IL 60455 and is currently estimated at $383,495, approximately $333 per square foot. 7311 W 74th St is a home located in Cook County with nearby schools including Bridgeview Elementary School, Argo Community High School, and Peckwas Preparatory Academy.
Ownership History
Date
Name
Owned For
Owner Type
Purchase Details
Closed on
Jun 8, 2010
Sold by
Srmek Bret and Srmek Darlene
Bought by
Losiniecki Jamie
Current Estimated Value
Home Financials for this Owner
Home Financials are based on the most recent Mortgage that was taken out on this home.
Original Mortgage
$218,048
Outstanding Balance
$146,454
Interest Rate
5.25%
Mortgage Type
FHA
Estimated Equity
$237,041
Purchase Details
Closed on
Sep 12, 2005
Sold by
Guidish John A
Bought by
Srmek Bret
Purchase Details
Closed on
Dec 10, 1999
Sold by
Loperena Anthony
Bought by
Guidish John A
Purchase Details
Closed on
Sep 29, 1993
Sold by
Bobak Joseph and Bobak Christine
Bought by
Loperena Anthony D
Home Financials for this Owner
Home Financials are based on the most recent Mortgage that was taken out on this home.
Original Mortgage
$120,000
Interest Rate
6.8%
Create a Home Valuation Report for This Property
The Home Valuation Report is an in-depth analysis detailing your home's value as well as a comparison with similar homes in the area
Home Values in the Area
Average Home Value in this Area
Purchase History
| Date | Buyer | Sale Price | Title Company |
|---|---|---|---|
| Losiniecki Jamie | $221,000 | Pntn | |
| Srmek Bret | -- | -- | |
| Guidish John A | $165,000 | -- | |
| Loperena Anthony D | $100,000 | -- |
Source: Public Records
Mortgage History
| Date | Status | Borrower | Loan Amount |
|---|---|---|---|
| Open | Losiniecki Jamie | $218,048 | |
| Previous Owner | Loperena Anthony D | $120,000 |
Source: Public Records
Tax History
| Year | Tax Paid | Tax Assessment Tax Assessment Total Assessment is a certain percentage of the fair market value that is determined by local assessors to be the total taxable value of land and additions on the property. | Land | Improvement |
|---|---|---|---|---|
| 2025 | $8,863 | $29,000 | $10,800 | $18,200 |
| 2024 | $8,863 | $29,000 | $10,800 | $18,200 |
| 2023 | $7,538 | $29,000 | $10,800 | $18,200 |
| 2022 | $7,538 | $22,278 | $9,600 | $12,678 |
| 2021 | $7,305 | $22,277 | $9,600 | $12,677 |
| 2020 | $7,159 | $22,277 | $9,600 | $12,677 |
| 2019 | $8,153 | $23,213 | $9,000 | $14,213 |
| 2018 | $7,789 | $23,213 | $9,000 | $14,213 |
| 2017 | $8,959 | $23,213 | $9,000 | $14,213 |
| 2016 | $7,515 | $18,351 | $7,800 | $10,551 |
| 2015 | $7,117 | $18,351 | $7,800 | $10,551 |
| 2014 | $6,880 | $18,351 | $7,800 | $10,551 |
| 2013 | $7,518 | $22,050 | $7,800 | $14,250 |
Source: Public Records
Map
Nearby Homes
- 7303 W 75th St
- 7435 W 74th St
- 7125 W 74th St
- 7216 S Octavia Ave
- 7332 Beloit Ave
- 7200 S Harlem Ave
- 7545 Beloit Ave
- 7153 W 72nd St
- 7635 S Oconto Ave
- 7506 S Ferdinand Ave
- 7600 S Ferdinand Ave
- 7000 W 74th St
- 7712 S Oketo Ave
- 7006 W 73rd St
- 7749 Odell Ave
- 7214 S 78th Ave
- 7838 W 73rd Place
- 7616 S 78th Ave
- 7715 New England Ave
- 7945 S Oketo Ave Unit 404
- 7313 W 74th St
- 7301 W 74th St
- 7410 S Octavia Ave
- 7319 W 74th St
- 7414 S Octavia Ave
- 7304 W 74th St
- 7320 W 74th St
- 7323 W 74th St
- 7416 S Octavia Ave
- 7330 S Octavia Ave
- 7318 W 74th St
- 7322 W 74th St
- 7346 W 74th St
- 7326 S Octavia Ave
- 7244 W 74th St
- 7335 W 74th St
- 7430 S Octavia Ave
- 7324 W 74th St
- 7242 W 74th St
- 7350 W 74th St
Your Personal Tour Guide
Ask me questions while you tour the home.