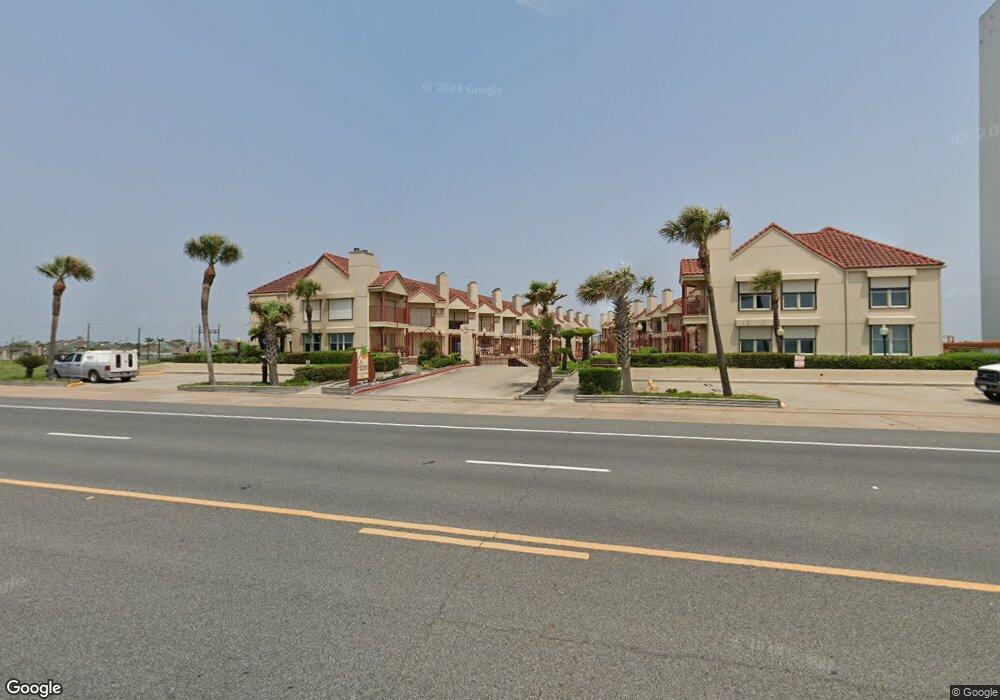
7312 Seawall Blvd Unit 221 Galveston, TX 77551
Lake Madeline NeighborhoodEstimated Value: $271,264 - $323,000
2
Beds
2
Baths
905
Sq Ft
$337/Sq Ft
Est. Value
About This Home
This home is located at 7312 Seawall Blvd Unit 221, Galveston, TX 77551 and is currently estimated at $305,066, approximately $337 per square foot. 7312 Seawall Blvd Unit 221 is a home located in Galveston County with nearby schools including Oppe Elementary School, Parker Elementary School, and Burnet STREAM Magnet School.
Ownership History
Date
Name
Owned For
Owner Type
Purchase Details
Closed on
Feb 5, 2016
Sold by
Williams Larry B and Williams Cindy A
Bought by
Gillespie William D and Gillespie Sherry L
Current Estimated Value
Home Financials for this Owner
Home Financials are based on the most recent Mortgage that was taken out on this home.
Original Mortgage
$132,000
Outstanding Balance
$105,364
Interest Rate
3.99%
Mortgage Type
New Conventional
Estimated Equity
$199,702
Purchase Details
Closed on
Jul 26, 2011
Sold by
Davis James E and Davis Miriam S
Bought by
Williams Larry B and Williams Cindy A
Purchase Details
Closed on
Feb 10, 2003
Sold by
Hunt Shirley H
Bought by
Davis James E
Home Financials for this Owner
Home Financials are based on the most recent Mortgage that was taken out on this home.
Original Mortgage
$62,800
Interest Rate
5.84%
Mortgage Type
Purchase Money Mortgage
Create a Home Valuation Report for This Property
The Home Valuation Report is an in-depth analysis detailing your home's value as well as a comparison with similar homes in the area
Home Values in the Area
Average Home Value in this Area
Purchase History
| Date | Buyer | Sale Price | Title Company |
|---|---|---|---|
| Gillespie William D | -- | South Land Title Llc | |
| Williams Larry B | -- | South Land Title Llc | |
| Davis James E | -- | Chicago Title |
Source: Public Records
Mortgage History
| Date | Status | Borrower | Loan Amount |
|---|---|---|---|
| Open | Gillespie William D | $132,000 | |
| Previous Owner | Davis James E | $62,800 |
Source: Public Records
Tax History Compared to Growth
Tax History
| Year | Tax Paid | Tax Assessment Tax Assessment Total Assessment is a certain percentage of the fair market value that is determined by local assessors to be the total taxable value of land and additions on the property. | Land | Improvement |
|---|---|---|---|---|
| 2025 | $5,400 | $297,550 | $16,970 | $280,580 |
| 2024 | $5,400 | $311,990 | $16,970 | $295,020 |
| 2023 | $5,400 | $276,960 | $16,970 | $259,990 |
| 2022 | $5,334 | $264,580 | $16,970 | $247,610 |
| 2021 | $5,051 | $223,310 | $16,970 | $206,340 |
| 2020 | $4,989 | $208,180 | $16,970 | $191,210 |
| 2019 | $4,659 | $188,920 | $16,970 | $171,950 |
| 2018 | $4,675 | $188,920 | $16,970 | $171,950 |
| 2017 | $3,946 | $161,410 | $16,970 | $144,440 |
| 2016 | $3,946 | $161,410 | $16,970 | $144,440 |
| 2015 | $2,970 | $120,000 | $16,970 | $103,030 |
| 2014 | $3,009 | $120,000 | $16,970 | $103,030 |
Source: Public Records
Map
Nearby Homes
- 7312 Seawall Blvd Unit 124
- 7312 Seawall Blvd Unit 209
- 7312 Seawall Blvd Unit 208
- 7312 Seawall Blvd Unit 217
- 7312 Seawall Blvd Unit 216
- 7312 Seawall Blvd
- 7312 Seawall Blvd Unit 109
- 7310 Seawall Blvd Unit 404
- 7310 Seawall Blvd Unit 205
- 7310 Seawall Blvd Unit 705
- 7310 Seawall Blvd Unit 409
- 7310 Seawall Blvd Unit 1101
- 7310 Seawall Blvd Unit 902/903
- 7310 Seawall Blvd
- 7310 Seawall Blvd Unit 1107
- 7310 Seawall Blvd Unit 1106
- 7310 Seawall Blvd Unit 309
- 7310 Seawall Blvd Unit 907
- 7310 Seawall Blvd Unit 707
- 7600 Seawall Blvd Unit 214
- 7312 Seawall Blvd Unit 118
- 7312 Seawall Blvd Unit 109
- 7312 Seawall Blvd Unit 204
- 7312 Seawall Blvd Unit 207
- 7312 Seawall Blvd Unit 202
- 7312 Seawall Blvd Unit 106
- 7312 Seawall Blvd Unit 201
- 7312 Seawall Blvd Unit 211
- 7312 Seawall Blvd Unit 103
- 7312 Seawall Blvd Unit 110
- 7312 Seawall Blvd Unit 205
- 7312 Seawall Blvd Unit 211
- 7312 Seawall Blvd Unit 123
- 7312 Seawall Blvd Unit 206
- 7312 Seawall Blvd Unit 202
- 7312 Seawall Blvd Unit 224
- 7312 Seawall Blvd Unit 217
- 7312 Seawall Blvd Unit 101
- 7312 Seawall Blvd Unit 106
- 7312 Seawall Blvd Unit 122