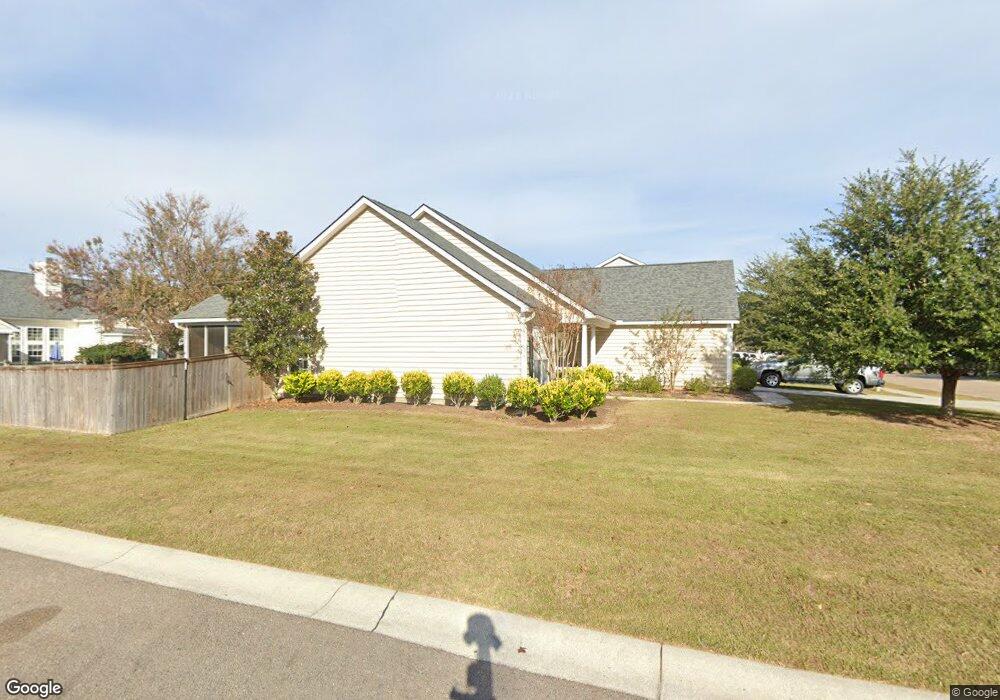
7314 Horned Grebe Ct Hanahan, SC 29410
Estimated Value: $416,761 - $479,000
--
Bed
--
Bath
1,678
Sq Ft
$267/Sq Ft
Est. Value
About This Home
This home is located at 7314 Horned Grebe Ct, Hanahan, SC 29410 and is currently estimated at $448,190, approximately $267 per square foot. 7314 Horned Grebe Ct is a home located in Berkeley County with nearby schools including Bowen's Corner Elementary, Hanahan Middle School, and Hanahan High School.
Ownership History
Date
Name
Owned For
Owner Type
Purchase Details
Closed on
Sep 29, 2006
Sold by
Beazer Homes Corp
Bought by
Frasier Earl and Frasier Debra L
Current Estimated Value
Home Financials for this Owner
Home Financials are based on the most recent Mortgage that was taken out on this home.
Original Mortgage
$204,273
Outstanding Balance
$122,028
Interest Rate
6.48%
Mortgage Type
Future Advance Clause Open End Mortgage
Estimated Equity
$326,162
Purchase Details
Closed on
Aug 29, 2006
Sold by
Charleston Brown Co Llc
Bought by
Beazer Homes Corp
Home Financials for this Owner
Home Financials are based on the most recent Mortgage that was taken out on this home.
Original Mortgage
$204,273
Outstanding Balance
$122,028
Interest Rate
6.48%
Mortgage Type
Future Advance Clause Open End Mortgage
Estimated Equity
$326,162
Create a Home Valuation Report for This Property
The Home Valuation Report is an in-depth analysis detailing your home's value as well as a comparison with similar homes in the area
Home Values in the Area
Average Home Value in this Area
Purchase History
| Date | Buyer | Sale Price | Title Company |
|---|---|---|---|
| Frasier Earl | $226,971 | None Available | |
| Beazer Homes Corp | $382,453 | None Available |
Source: Public Records
Mortgage History
| Date | Status | Borrower | Loan Amount |
|---|---|---|---|
| Open | Frasier Earl | $204,273 |
Source: Public Records
Tax History Compared to Growth
Tax History
| Year | Tax Paid | Tax Assessment Tax Assessment Total Assessment is a certain percentage of the fair market value that is determined by local assessors to be the total taxable value of land and additions on the property. | Land | Improvement |
|---|---|---|---|---|
| 2025 | $1,471 | $260,533 | $57,344 | $203,189 |
| 2024 | $1,471 | $10,422 | $2,294 | $8,128 |
| 2023 | $1,471 | $10,422 | $2,294 | $8,128 |
| 2022 | $1,435 | $9,062 | $1,735 | $7,327 |
| 2021 | $1,352 | $9,060 | $1,735 | $7,327 |
| 2020 | $1,273 | $9,062 | $1,735 | $7,327 |
| 2019 | $1,321 | $9,062 | $1,735 | $7,327 |
| 2018 | $1,215 | $7,880 | $1,720 | $6,160 |
| 2017 | $1,190 | $7,880 | $1,720 | $6,160 |
| 2016 | $1,211 | $7,880 | $1,720 | $6,160 |
| 2015 | $1,064 | $7,880 | $1,720 | $6,160 |
| 2014 | $1,042 | $7,880 | $1,720 | $6,160 |
| 2013 | -- | $7,880 | $1,720 | $6,160 |
Source: Public Records
Map
Nearby Homes
- 7317 Horned Grebe Ct
- 7326 Kestrel Trail
- 7316 Water Thrush Ct
- 7304 Kestrel Trail
- 7303 Kestrel Trail
- 7358 Suncatcher Dr
- 1333 Song Sparrow Way
- 7316 Stoney Moss Way
- 7434 Northgate Dr
- 7402 Purser Ln
- 7406 Mercedes Way
- 1038 Old Cypress Run
- 7217 Mossy Creek Ln
- 1203 Saffron Ln
- 1235 Woodsage Dr
- 7532 Hawks Cir
- 202 Waterwood Dr Unit 2302
- 605 Waterwood Dr Unit 1505
- 2000 Callaway Cir
- 607 Waterwood Dr
- 7316 Horned Grebe Ct
- 202 Horned Grebe Ct
- 206 Horned Grebe Ct
- 7321 Brown Thrasher Ct
- 7323 Brown Thrasher Ct
- 7318 Horned Grebe Ct
- 7319 Brown Thrasher Ct
- 7313 Horned Grebe Ct
- 7315 Horned Grebe Ct
- 7325 Brown Thrasher Ct
- 7306 Horned Grebe Ct
- 7311 Horned Grebe Ct
- 7320 Horned Grebe Ct
- 7317 Brown Thrasher Ct
- 7327 Brown Thrasher Ct
- 7309 Horned Grebe Ct
- 7319 Horned Grebe Ct
- 7304 Horned Grebe Ct
- 7322 Brown Thrasher Ct
- 7322 Horned Grebe Ct