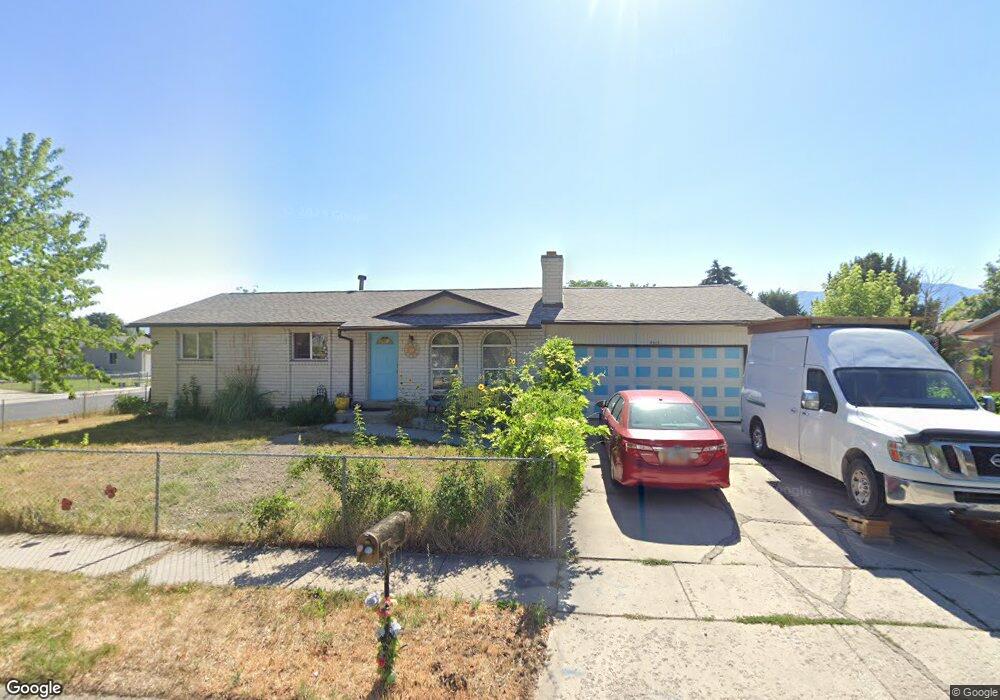
7315 S 2172 W West Jordan, UT 84084
Estimated Value: $481,000 - $502,000
4
Beds
2
Baths
2,000
Sq Ft
$245/Sq Ft
Est. Value
About This Home
This home is located at 7315 S 2172 W, West Jordan, UT 84084 and is currently estimated at $490,437, approximately $245 per square foot. 7315 S 2172 W is a home located in Salt Lake County with nearby schools including Majestic Elementary Arts Academy, West Jordan Middle School, and West Jordan High School.
Ownership History
Date
Name
Owned For
Owner Type
Purchase Details
Closed on
Sep 2, 2015
Sold by
Carter Mary Dalene
Bought by
Alvey Chantelle
Current Estimated Value
Home Financials for this Owner
Home Financials are based on the most recent Mortgage that was taken out on this home.
Original Mortgage
$222,888
Outstanding Balance
$177,937
Interest Rate
4.4%
Mortgage Type
FHA
Estimated Equity
$312,500
Purchase Details
Closed on
Nov 14, 2006
Sold by
Carter Allen D and Carter Mary D
Bought by
Carter Allen D and Carter Mary Dalene
Purchase Details
Closed on
Dec 16, 2005
Sold by
Mcclure Sylvia
Bought by
Carter Allen D and Carter Mary D
Purchase Details
Closed on
Dec 10, 2005
Sold by
Carbajal Josephine
Bought by
Mcclure Sylvia
Purchase Details
Closed on
Jan 8, 1996
Sold by
Carbajal Josephine
Bought by
Carbajal Josephine
Home Financials for this Owner
Home Financials are based on the most recent Mortgage that was taken out on this home.
Original Mortgage
$35,000
Interest Rate
7.03%
Create a Home Valuation Report for This Property
The Home Valuation Report is an in-depth analysis detailing your home's value as well as a comparison with similar homes in the area
Home Values in the Area
Average Home Value in this Area
Purchase History
| Date | Buyer | Sale Price | Title Company |
|---|---|---|---|
| Alvey Chantelle | -- | Key Land Title | |
| Carter Allen D | -- | None Available | |
| Carter Allen D | -- | None Available | |
| Mcclure Sylvia | -- | None Available | |
| Carbajal Josephine | -- | -- |
Source: Public Records
Mortgage History
| Date | Status | Borrower | Loan Amount |
|---|---|---|---|
| Open | Alvey Chantelle | $222,888 | |
| Previous Owner | Carbajal Josephine | $35,000 |
Source: Public Records
Tax History Compared to Growth
Tax History
| Year | Tax Paid | Tax Assessment Tax Assessment Total Assessment is a certain percentage of the fair market value that is determined by local assessors to be the total taxable value of land and additions on the property. | Land | Improvement |
|---|---|---|---|---|
| 2025 | $2,240 | $447,400 | $130,300 | $317,100 |
| 2024 | $2,240 | $430,900 | $125,700 | $305,200 |
| 2023 | $2,135 | $387,100 | $119,700 | $267,400 |
| 2022 | $2,214 | $394,900 | $117,400 | $277,500 |
| 2021 | $1,849 | $300,300 | $95,800 | $204,500 |
| 2020 | $1,742 | $265,500 | $95,800 | $169,700 |
| 2019 | $1,755 | $262,300 | $95,800 | $166,500 |
| 2018 | $1,592 | $236,000 | $72,300 | $163,700 |
| 2017 | $1,477 | $218,000 | $72,300 | $145,700 |
| 2016 | $1,447 | $200,700 | $72,300 | $128,400 |
| 2015 | $1,465 | $198,100 | $82,600 | $115,500 |
| 2014 | -- | $186,800 | $78,600 | $108,200 |
Source: Public Records
Map
Nearby Homes
- 2312 W Hidden Bend Cove Unit 107
- 1951 W 7125 S
- 7150 Camelot Way
- 7149 S Camelot Way
- 7279 S Kenadi Ct
- 2169 W 7600 S
- 2510 W Jordan Meadows Ln
- 1718 W Trey Way Unit 2
- 2573 Jordan Meadows Ln
- 7645 S 1960 W
- 2062 W 7705 S
- 6924 S 2160 W
- 2386 W 7680 S
- 1817 W 7600 S Unit I204
- 1829 W 7600 S Unit G301
- 6925 S Lexington Dr
- 7647 S 2500 W
- 7361 S 2700 W
- 1801 W 7600 S Unit C201
- 1805 W 7600 S Unit D204
- 2149 Arthur Dr
- 7333 S 2172 W
- 2146 Knights Way
- 2158 Arthur Dr
- 2135 Arthur Dr
- 2135 W Arthur Dr
- 2179 W Arthur Dr
- 7328 S 2172 W
- 2134 Knights Way
- 2144 Arthur Dr
- 2178 Arthur Dr
- 2178 W Arthur Dr
- 7338 S 2172 W
- 2121 W Arthur Dr
- 2121 Arthur Dr
- 2122 Knights Way
- 7353 S 2172 W
- 7289 Little Cir
- 2145 Knights Way
- 7348 S 2172 W