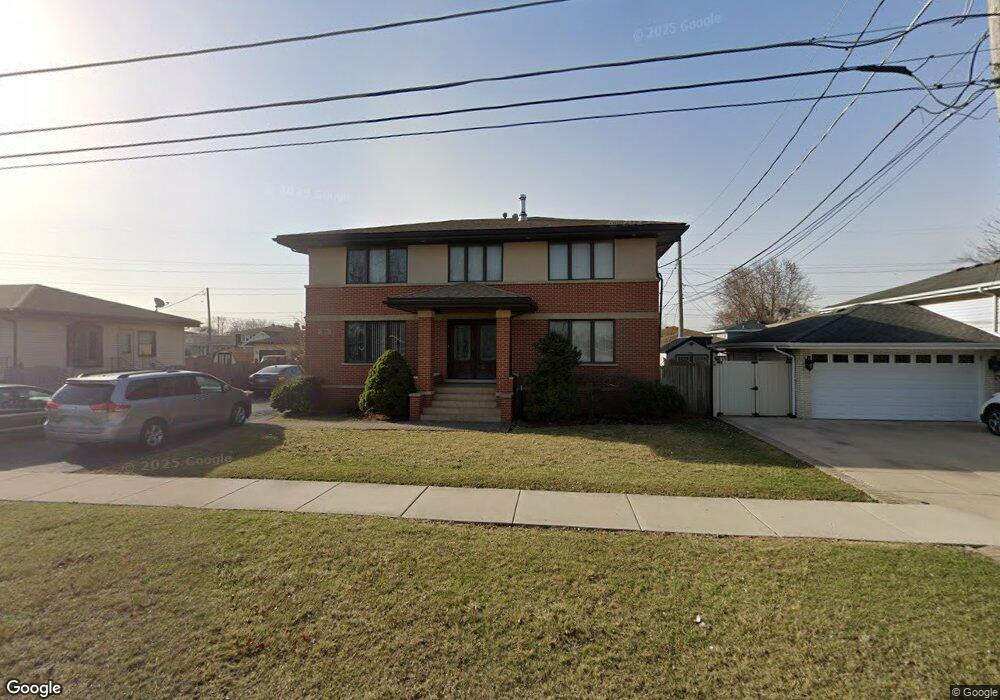
7315 W 83rd St Bridgeview, IL 60455
Estimated Value: $411,544 - $479,000
3
Beds
3
Baths
2,240
Sq Ft
$195/Sq Ft
Est. Value
About This Home
This home is located at 7315 W 83rd St, Bridgeview, IL 60455 and is currently estimated at $437,136, approximately $195 per square foot. 7315 W 83rd St is a home located in Cook County with nearby schools including Bridgeview Elementary School, Argo Community High School, and Aqsa School.
Ownership History
Date
Name
Owned For
Owner Type
Purchase Details
Closed on
May 18, 2016
Sold by
Podraza Zbigniew
Bought by
Albarti Ameen
Current Estimated Value
Home Financials for this Owner
Home Financials are based on the most recent Mortgage that was taken out on this home.
Original Mortgage
$248,000
Outstanding Balance
$197,186
Interest Rate
3.87%
Mortgage Type
New Conventional
Estimated Equity
$239,950
Purchase Details
Closed on
May 1, 2011
Sold by
Sito Agnieszka and Podraza Agnieszka
Bought by
Podraza Zbigniew
Purchase Details
Closed on
Mar 21, 2003
Sold by
Balding Eleanor C
Bought by
Podraza Zbigniew and Podraza Agnieszka
Home Financials for this Owner
Home Financials are based on the most recent Mortgage that was taken out on this home.
Original Mortgage
$138,700
Interest Rate
4.5%
Mortgage Type
Unknown
Create a Home Valuation Report for This Property
The Home Valuation Report is an in-depth analysis detailing your home's value as well as a comparison with similar homes in the area
Home Values in the Area
Average Home Value in this Area
Purchase History
| Date | Buyer | Sale Price | Title Company |
|---|---|---|---|
| Albarti Ameen | $310,000 | Citywide Title Corporation | |
| Podraza Zbigniew | -- | None Available | |
| Podraza Zbigniew | $146,500 | Ticor Title | |
| Podraza Zbigniew | $146,500 | Ticor Title |
Source: Public Records
Mortgage History
| Date | Status | Borrower | Loan Amount |
|---|---|---|---|
| Open | Albarti Ameen | $248,000 | |
| Previous Owner | Podraza Zbigniew | $138,700 | |
| Closed | Podraza Zbigniew | $3,500 |
Source: Public Records
Tax History
| Year | Tax Paid | Tax Assessment Tax Assessment Total Assessment is a certain percentage of the fair market value that is determined by local assessors to be the total taxable value of land and additions on the property. | Land | Improvement |
|---|---|---|---|---|
| 2025 | $10,933 | $28,655 | $3,970 | $24,685 |
| 2024 | $10,933 | $29,955 | $3,970 | $25,985 |
| 2023 | $9,863 | $35,001 | $3,970 | $31,031 |
| 2022 | $9,863 | $28,095 | $3,528 | $24,567 |
| 2021 | $9,548 | $28,094 | $3,528 | $24,566 |
| 2020 | $9,330 | $28,094 | $3,528 | $24,566 |
| 2019 | $8,646 | $24,408 | $3,307 | $21,101 |
| 2018 | $8,260 | $24,408 | $3,307 | $21,101 |
| 2017 | $9,051 | $26,827 | $3,307 | $23,520 |
| 2016 | $7,889 | $21,760 | $2,866 | $18,894 |
| 2015 | $7,422 | $21,760 | $2,866 | $18,894 |
| 2014 | $7,195 | $21,760 | $2,866 | $18,894 |
| 2013 | $8,255 | $26,843 | $2,866 | $23,977 |
Source: Public Records
Map
Nearby Homes
- 7234 W 85th St
- 8233 S 76th Ave
- 8101 S Oketo Ave
- 7329 W 85th Place Unit 2A
- 7110 W 82nd Place
- 7132 W 84th Place
- 7700 W 83rd St
- 7347 W 79th Place Unit 2D
- 7945 S Oketo Ave Unit 404
- 7945 S Oketo Ave Unit 408
- 8356 Sayre Ave
- 7722 W 81st Place
- 7705 W 80th Place
- 7656 W 80th Place
- 8800 S Harlem Ave Unit 2311
- 8800 S Harlem Ave Unit 2111
- 8800 S Harlem Ave Unit 326
- 8800 S Harlem Ave Unit 1127
- 8800 S Harlem Ave Unit 2000A
- 7806 W 83rd St
- 7313 W 83rd St
- 8301 S Oketo Ave
- 8307 S Oketo Ave
- 8311 S Oketo Ave
- 7340 W 83rd Place
- 7311 W 83rd St
- 7332 W 83rd Place
- 7332 W 83rd Place
- 7324 W 83rd Place
- 8255 S Oketo Ave
- 8315 S Oketo Ave
- 7309 W 83rd St
- 7334 W 83rd St
- 7316 W 83rd Place
- 8251 S Oketo Ave
- 8300 S Oketo Ave
- 7307 W 83rd St
- 8306 S Oketo Ave
- 7335 W 83rd Place
- 7330 W 83rd St
Your Personal Tour Guide
Ask me questions while you tour the home.