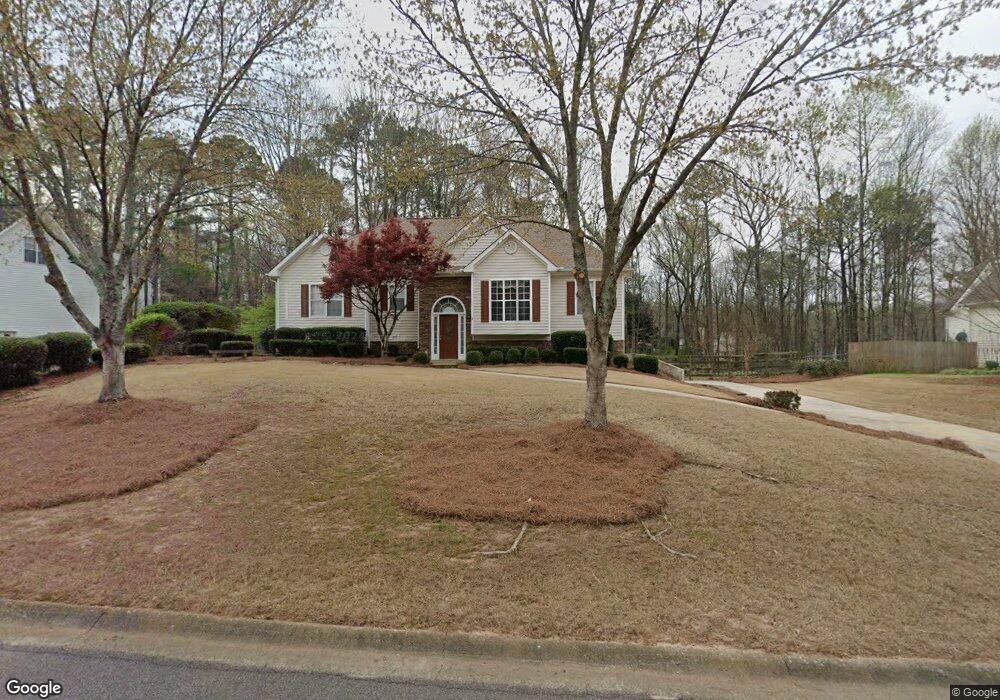
7315 Walnut Mill Landing Unit 2 Cumming, GA 30040
Estimated Value: $391,481 - $413,000
3
Beds
2
Baths
1,445
Sq Ft
$278/Sq Ft
Est. Value
About This Home
This home is located at 7315 Walnut Mill Landing Unit 2, Cumming, GA 30040 and is currently estimated at $402,370, approximately $278 per square foot. 7315 Walnut Mill Landing Unit 2 is a home located in Forsyth County with nearby schools including Coal Mountain Elementary School, North Forsyth Middle School, and North Forsyth High School.
Ownership History
Date
Name
Owned For
Owner Type
Purchase Details
Closed on
Nov 12, 2004
Sold by
Mackie David I and Mackie Carol
Bought by
Hopkins Laura A
Current Estimated Value
Home Financials for this Owner
Home Financials are based on the most recent Mortgage that was taken out on this home.
Original Mortgage
$137,700
Outstanding Balance
$63,958
Interest Rate
4.75%
Mortgage Type
New Conventional
Estimated Equity
$338,412
Purchase Details
Closed on
Aug 29, 1997
Sold by
Nation Built Homes Inc
Bought by
Mackie David I and Mackie Carol C
Home Financials for this Owner
Home Financials are based on the most recent Mortgage that was taken out on this home.
Original Mortgage
$138,535
Interest Rate
7.39%
Mortgage Type
VA
Purchase Details
Closed on
Jan 16, 1997
Sold by
Develcorp Eagle
Bought by
Builthomes Nation
Create a Home Valuation Report for This Property
The Home Valuation Report is an in-depth analysis detailing your home's value as well as a comparison with similar homes in the area
Home Values in the Area
Average Home Value in this Area
Purchase History
| Date | Buyer | Sale Price | Title Company |
|---|---|---|---|
| Hopkins Laura A | $172,200 | -- | |
| Mackie David I | $134,500 | -- | |
| Builthomes Nation | $25,000 | -- |
Source: Public Records
Mortgage History
| Date | Status | Borrower | Loan Amount |
|---|---|---|---|
| Open | Builthomes Nation | $64,759 | |
| Open | Hopkins Laura A | $137,700 | |
| Previous Owner | Mackie David I | $138,535 | |
| Closed | Builthomes Nation | $0 |
Source: Public Records
Tax History Compared to Growth
Tax History
| Year | Tax Paid | Tax Assessment Tax Assessment Total Assessment is a certain percentage of the fair market value that is determined by local assessors to be the total taxable value of land and additions on the property. | Land | Improvement |
|---|---|---|---|---|
| 2025 | $2,821 | $140,660 | $52,000 | $88,660 |
| 2024 | $2,821 | $143,060 | $48,000 | $95,060 |
| 2023 | $2,355 | $136,936 | $36,000 | $100,936 |
| 2022 | $2,511 | $90,652 | $24,000 | $66,652 |
| 2021 | $2,207 | $90,652 | $24,000 | $66,652 |
| 2020 | $2,147 | $87,752 | $24,000 | $63,752 |
| 2019 | $2,043 | $82,532 | $20,000 | $62,532 |
| 2018 | $1,805 | $70,752 | $18,000 | $52,752 |
| 2017 | $1,676 | $64,324 | $16,000 | $48,324 |
| 2016 | $1,676 | $64,324 | $16,000 | $48,324 |
| 2015 | $1,637 | $62,324 | $14,000 | $48,324 |
| 2014 | $1,401 | $56,224 | $0 | $0 |
Source: Public Records
Map
Nearby Homes
- 7325 Walnut Mill Landing
- 7235 Walnut Mill Landing
- 7240 Hickory Bluff Dr Unit 2
- 7250 Hickory Bluff Dr
- 7335 Walnut Mill Landing Unit 2
- 0 Sleepy Hollow Ct Unit 7482050
- 0 Sleepy Hollow Ct Unit 8529708
- 0 Sleepy Hollow Ct Unit 9007785
- 0 Sleepy Hollow Ct Unit 9026143
- 7220 Hickory Bluff Dr
- 7315 Sleepy Hollow Ct
- 7320 Walnut Mill Landing
- 7260 Hickory Bluff Dr
- 7330 Sleepy Hollow Ct Unit 217
- 7330 Sleepy Hollow Ct
- 7340 Walnut Mill Landing
- 7270 Hickory Bluff Dr
- 7460 Blueberry Ln
- 7450 Blueberry Ln
- 7220 Walnut Mill Landing