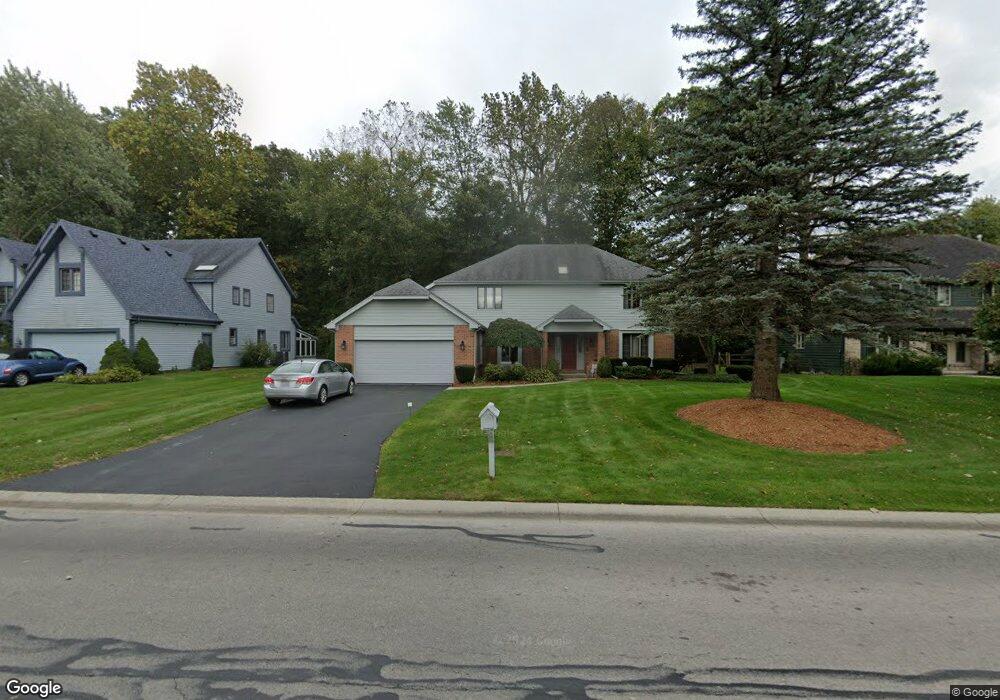
7315 Whispering Oak Dr Sylvania, OH 43560
Estimated Value: $403,000 - $433,000
4
Beds
3
Baths
2,848
Sq Ft
$148/Sq Ft
Est. Value
About This Home
This home is located at 7315 Whispering Oak Dr, Sylvania, OH 43560 and is currently estimated at $420,116, approximately $147 per square foot. 7315 Whispering Oak Dr is a home located in Lucas County with nearby schools including Maplewood Elementary School, Sylvania McCord Junior High School, and Sylvania Northview High School.
Ownership History
Date
Name
Owned For
Owner Type
Purchase Details
Closed on
Oct 2, 2020
Sold by
Gildea James C and Gildea Candy L
Bought by
Gildea James C and Gildea Candy L
Current Estimated Value
Purchase Details
Closed on
Aug 11, 1997
Sold by
Fox Kendall
Bought by
Gildea James C and Gildea Candy L
Home Financials for this Owner
Home Financials are based on the most recent Mortgage that was taken out on this home.
Original Mortgage
$159,900
Interest Rate
7.68%
Mortgage Type
Balloon
Purchase Details
Closed on
Mar 15, 1996
Sold by
Tyrkus Michael
Bought by
Fox Kendall B and Fox Marie L
Home Financials for this Owner
Home Financials are based on the most recent Mortgage that was taken out on this home.
Original Mortgage
$198,000
Interest Rate
7.06%
Mortgage Type
New Conventional
Purchase Details
Closed on
May 18, 1992
Purchase Details
Closed on
Feb 25, 1992
Sold by
Andronek Nerieda M
Purchase Details
Closed on
Jul 13, 1988
Sold by
Becker Barry M and Becker Beverly
Create a Home Valuation Report for This Property
The Home Valuation Report is an in-depth analysis detailing your home's value as well as a comparison with similar homes in the area
Home Values in the Area
Average Home Value in this Area
Purchase History
| Date | Buyer | Sale Price | Title Company |
|---|---|---|---|
| Gildea James C | -- | None Available | |
| Gildea James C | $224,900 | -- | |
| Fox Kendall B | $220,000 | -- | |
| -- | $189,900 | -- | |
| -- | $168,000 | -- | |
| -- | $195,500 | -- |
Source: Public Records
Mortgage History
| Date | Status | Borrower | Loan Amount |
|---|---|---|---|
| Closed | Gildea James C | $159,900 | |
| Previous Owner | Fox Kendall B | $198,000 |
Source: Public Records
Tax History Compared to Growth
Tax History
| Year | Tax Paid | Tax Assessment Tax Assessment Total Assessment is a certain percentage of the fair market value that is determined by local assessors to be the total taxable value of land and additions on the property. | Land | Improvement |
|---|---|---|---|---|
| 2024 | $4,716 | $146,965 | $19,740 | $127,225 |
| 2023 | $9,104 | $121,730 | $16,800 | $104,930 |
| 2022 | $9,110 | $121,730 | $16,800 | $104,930 |
| 2021 | $9,331 | $121,730 | $16,800 | $104,930 |
| 2020 | $8,841 | $102,095 | $14,035 | $88,060 |
| 2019 | $8,514 | $102,095 | $14,035 | $88,060 |
| 2018 | $8,015 | $102,095 | $14,035 | $88,060 |
| 2017 | $8,142 | $88,900 | $10,990 | $77,910 |
| 2016 | $7,986 | $254,000 | $31,400 | $222,600 |
| 2015 | $7,530 | $254,000 | $31,400 | $222,600 |
| 2014 | $7,188 | $85,470 | $10,570 | $74,900 |
| 2013 | $7,188 | $85,470 | $10,570 | $74,900 |
Source: Public Records
Map
Nearby Homes
- 5310 Turnberry Ln
- 7345 Country Commons Ln
- 4850 Tamworth Rd
- 4902 Marble Cliff Blvd
- 5144 Franciscan Blvd
- 7030 Hickory Ridge Rd
- 4814 Sylvan Ct
- 7428 Kings Walk Ln
- 4610 Woodland Ln
- 6922 Gettysburg Dr
- 4533 Gettysburg Dr
- 4504 Promenade Ln
- 6807 Gettysburg Dr
- 5235 Brookfield Ln
- 6641 Convent Blvd
- 6708 Gettysburg Dr
- 9152 Mill St
- 6584 Brint Rd
- 7565 Peachtree Ln
- 5914 Winding Way Dr
- 7307 Whispering Oak Dr
- 7325 Whispering Oak Dr
- 5158 Honora Dr
- 7265 Whispering Oak Dr
- 7333 Whispering Oak Dr
- 7306 Whispering Oak Dr
- 7257 Whispering Oak Dr
- 7341 Whispering Oak Dr
- 5146 Honora Dr
- 7264 Whispering Oak Dr
- 5155 Honora Dr
- 5236 Spring Creek Ln
- 5237 Spring Creek Ln
- 7248 Forest Brook Dr
- 5140 Honora Dr
- 7340 Whispering Oak Dr
- 7256 Whispering Oak Dr
- 7249 Whispering Oak Dr
- 7249 Whispering Oak Dr Unit 1
- 7351 Whispering Oak Dr