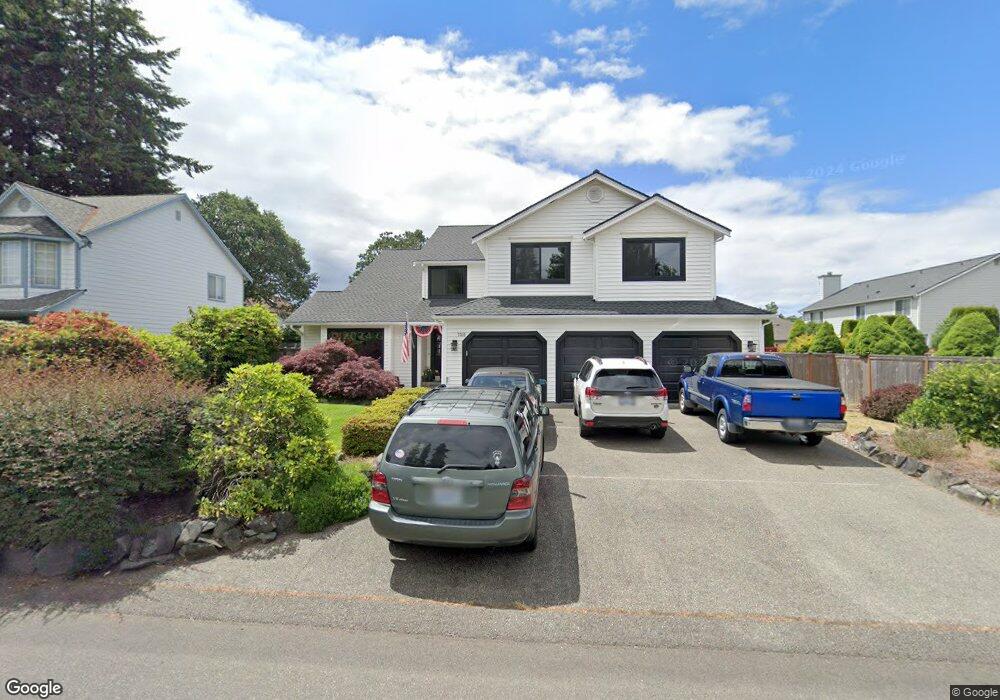
7316 91st Avenue Ct SW Lakewood, WA 98498
Oakbrook NeighborhoodEstimated Value: $737,565 - $987,000
4
Beds
3
Baths
3,108
Sq Ft
$265/Sq Ft
Est. Value
About This Home
This home is located at 7316 91st Avenue Ct SW, Lakewood, WA 98498 and is currently estimated at $824,891, approximately $265 per square foot. 7316 91st Avenue Ct SW is a home located in Pierce County with nearby schools including Oakbrook Elementary School, Hudtloff Middle School, and Lakes High School.
Ownership History
Date
Name
Owned For
Owner Type
Purchase Details
Closed on
Nov 4, 2011
Sold by
Fannie Mae
Bought by
Layne James and Layne Sarah L
Current Estimated Value
Home Financials for this Owner
Home Financials are based on the most recent Mortgage that was taken out on this home.
Original Mortgage
$261,542
Outstanding Balance
$177,742
Interest Rate
3.95%
Mortgage Type
New Conventional
Estimated Equity
$647,149
Purchase Details
Closed on
Mar 22, 2011
Sold by
Lee Kie Y and Lee Myong S
Bought by
Federal National Mortgage Association
Purchase Details
Closed on
May 30, 2006
Sold by
Rock David P and Rock Barbara M
Bought by
Lee Kie Y and Lee Myong S
Home Financials for this Owner
Home Financials are based on the most recent Mortgage that was taken out on this home.
Original Mortgage
$321,600
Interest Rate
6.12%
Mortgage Type
Fannie Mae Freddie Mac
Purchase Details
Closed on
Apr 20, 1999
Sold by
Lee Peter K
Bought by
Rock David P and Rock Barbara M
Home Financials for this Owner
Home Financials are based on the most recent Mortgage that was taken out on this home.
Original Mortgage
$153,000
Interest Rate
6.98%
Create a Home Valuation Report for This Property
The Home Valuation Report is an in-depth analysis detailing your home's value as well as a comparison with similar homes in the area
Home Values in the Area
Average Home Value in this Area
Purchase History
| Date | Buyer | Sale Price | Title Company |
|---|---|---|---|
| Layne James | -- | Stewart Title Company | |
| Federal National Mortgage Association | $347,795 | None Available | |
| Lee Kie Y | $402,000 | Chicago Title Insurance Co | |
| Rock David P | $248,967 | -- |
Source: Public Records
Mortgage History
| Date | Status | Borrower | Loan Amount |
|---|---|---|---|
| Open | Layne James | $261,542 | |
| Previous Owner | Lee Kie Y | $321,600 | |
| Previous Owner | Rock David P | $153,000 |
Source: Public Records
Tax History Compared to Growth
Tax History
| Year | Tax Paid | Tax Assessment Tax Assessment Total Assessment is a certain percentage of the fair market value that is determined by local assessors to be the total taxable value of land and additions on the property. | Land | Improvement |
|---|---|---|---|---|
| 2025 | $6,791 | $736,000 | $230,800 | $505,200 |
| 2024 | $6,791 | $701,900 | $221,600 | $480,300 |
| 2023 | $6,791 | $634,000 | $208,300 | $425,700 |
| 2022 | $6,531 | $654,400 | $216,400 | $438,000 |
| 2021 | $6,080 | $470,800 | $140,600 | $330,200 |
| 2019 | $5,110 | $438,800 | $121,700 | $317,100 |
| 2018 | $5,664 | $431,800 | $110,200 | $321,600 |
| 2017 | $5,405 | $386,500 | $89,300 | $297,200 |
| 2016 | $4,856 | $327,900 | $69,900 | $258,000 |
| 2014 | $4,347 | $308,500 | $63,600 | $244,900 |
| 2013 | $4,347 | $285,100 | $55,400 | $229,700 |
Source: Public Records
Map
Nearby Homes
- 9012 71st Street Ct SW Unit 9012
- 9220 77th St SW Unit B
- 7616 93rd Avenue Ct SW
- 9421 Zircon Dr SW
- 7725 91st Ave SW
- 8804 71st Street Ct SW Unit 8804
- 9220 78th St SW
- 9711 Onyx Dr SW
- 8609 Zircon Dr SW Unit E4
- 8639 Zircon Dr SW Unit T3
- 8641 Zircon Dr SW Unit U3
- 8401 Zircon Dr SW Unit C38
- 8202 Coral Place SW
- 8636 Onyx Dr SW Unit C
- 8820 Chambers Creek Rd W
- 8001 Sapphire Dr SW
- 7859 Agate Dr SW
- 7822 76th St SW
- 6223 85th Ave W
- 7607 Emerald Dr SW
- 7316 91st Avenue Ct SW
- 7320 91st Ave SW
- 9110 73rd Street Ct SW
- 9116 73rd Street Ct SW
- 9205 74th St SW
- 7317 91st Avenue Ct SW
- 9203 74th St SW
- 9202 73rd Street Ct SW
- 7321 91st Avenue Ct SW
- 7309 91st Avenue Ct SW
- 9209 74th St SW
- 9208 73rd Street Ct SW
- 7408 91st Avenue Ct SW
- 9204 74th St SW
- 9109 73rd Street Ct SW
- 9115 73rd Street Ct SW
- 7402 91st Ave SW
- 9215 74th St SW
- 7404 91st Ave SW
- 7404 91st Ave SW