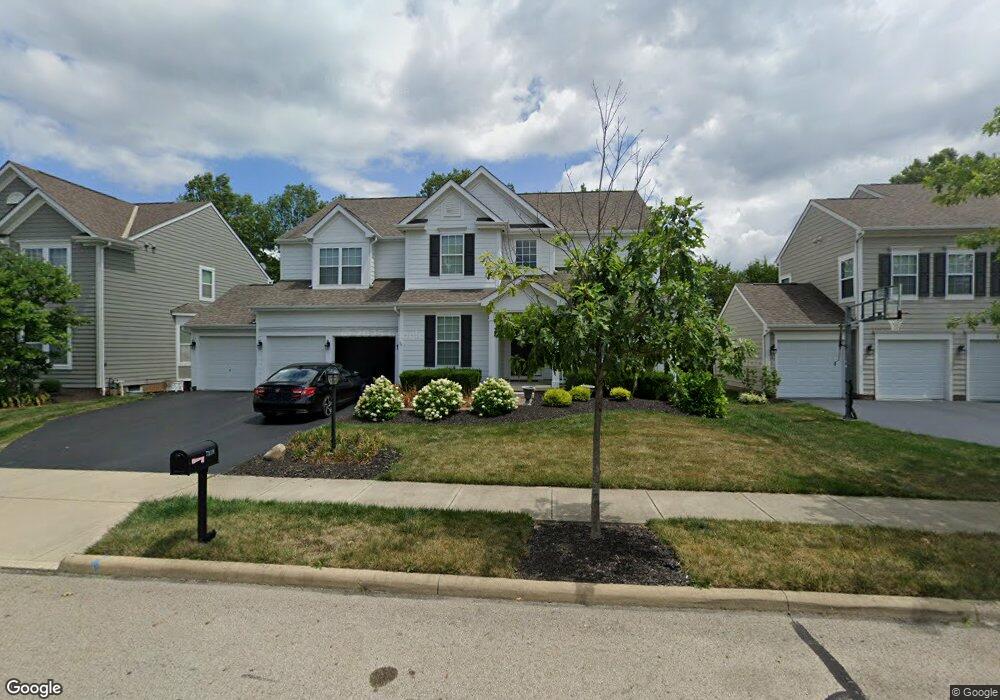
7318 Upper Clarenton Dr S New Albany, OH 43054
Estimated Value: $785,000 - $922,000
4
Beds
4
Baths
3,631
Sq Ft
$227/Sq Ft
Est. Value
About This Home
This home is located at 7318 Upper Clarenton Dr S, New Albany, OH 43054 and is currently estimated at $824,831, approximately $227 per square foot. 7318 Upper Clarenton Dr S is a home located in Franklin County with nearby schools including New Albany Primary School, New Albany Intermediate School, and New Albany Middle School.
Ownership History
Date
Name
Owned For
Owner Type
Purchase Details
Closed on
Apr 15, 2010
Sold by
M/I Homes Of Central Ohio Llc
Bought by
Ecleberry Gregory T and Ecleberry Amy L
Current Estimated Value
Home Financials for this Owner
Home Financials are based on the most recent Mortgage that was taken out on this home.
Original Mortgage
$200,000
Outstanding Balance
$133,273
Interest Rate
5.01%
Mortgage Type
New Conventional
Estimated Equity
$691,558
Create a Home Valuation Report for This Property
The Home Valuation Report is an in-depth analysis detailing your home's value as well as a comparison with similar homes in the area
Home Values in the Area
Average Home Value in this Area
Purchase History
| Date | Buyer | Sale Price | Title Company |
|---|---|---|---|
| Ecleberry Gregory T | $333,500 | Transohio |
Source: Public Records
Mortgage History
| Date | Status | Borrower | Loan Amount |
|---|---|---|---|
| Open | Ecleberry Gregory T | $200,000 |
Source: Public Records
Tax History Compared to Growth
Tax History
| Year | Tax Paid | Tax Assessment Tax Assessment Total Assessment is a certain percentage of the fair market value that is determined by local assessors to be the total taxable value of land and additions on the property. | Land | Improvement |
|---|---|---|---|---|
| 2024 | $13,941 | $224,080 | $45,510 | $178,570 |
| 2023 | $13,227 | $224,080 | $45,510 | $178,570 |
| 2022 | $14,473 | $187,020 | $40,260 | $146,760 |
| 2021 | $13,929 | $187,020 | $40,260 | $146,760 |
| 2020 | $13,861 | $187,020 | $40,260 | $146,760 |
| 2019 | $13,229 | $162,620 | $35,010 | $127,610 |
| 2018 | $11,856 | $162,620 | $35,010 | $127,610 |
| 2017 | $11,504 | $152,610 | $35,010 | $117,600 |
| 2016 | $10,653 | $120,690 | $27,520 | $93,170 |
| 2015 | $10,190 | $120,690 | $27,520 | $93,170 |
| 2014 | $10,006 | $120,690 | $27,520 | $93,170 |
| 2013 | $805 | $12,845 | $12,845 | $0 |
Source: Public Records
Map
Nearby Homes
- 7301 Wood Edge Ln
- 7385 Wood Edge Ln
- 7361 Wood Edge Ln
- 7125 Longfield Ct
- 8600 Steeple Wood Dr
- 6879 E Walnut St
- 7477 New Albany Links Dr
- 0 Luna Unit Lot 10 225003340
- 0 Luna Unit Lot 9 225003339
- 0 Moonstone Unit Lot 12 225003342
- 0 Moonstone Unit Lot 11 225003341
- 0 Moonstone Unit Lot 5 225003337
- 0 Moonstone Unit LOT 4 225003335
- 0 Moonstone Unit LOT 3 225003334
- 0 Moonstone Unit LOT 2 225003333
- 0 Moonstone Unit LOT 1 225003332
- 7075 Maynard Place
- 5685 Jersey Dr
- 7072 Maynard Place E
- The Iris Residence Plan at Estates at Albany Acres
- 7328 Upper Clarenton Dr S
- 7308 Upper Clarenton Dr S Unit 82
- 7338 Upper Clarenton Dr S
- 8446 Leisner Ave
- 7298 Upper Clarenton Dr S
- 8447 Tournus Way
- 7288 Upper Clarenton Dr S
- 8436 Leisner Ave
- 8437 Tournus Way
- 7278 Upper Clarenton Dr S
- 7348 Upper Clarenton Dr S
- 8426 Leisner Ave
- 8426 Leisner Ave Unit 86
- 7349 Upper Clarenton Dr S
- 8247 Tournus Way Unit 91
- 8427 Tournus Way
- 8443 Kiernan Dr
- 7268 Upper Clarenton Dr S
- 7358 Upper Clarenton Dr S
- 8416 Leisner Ave