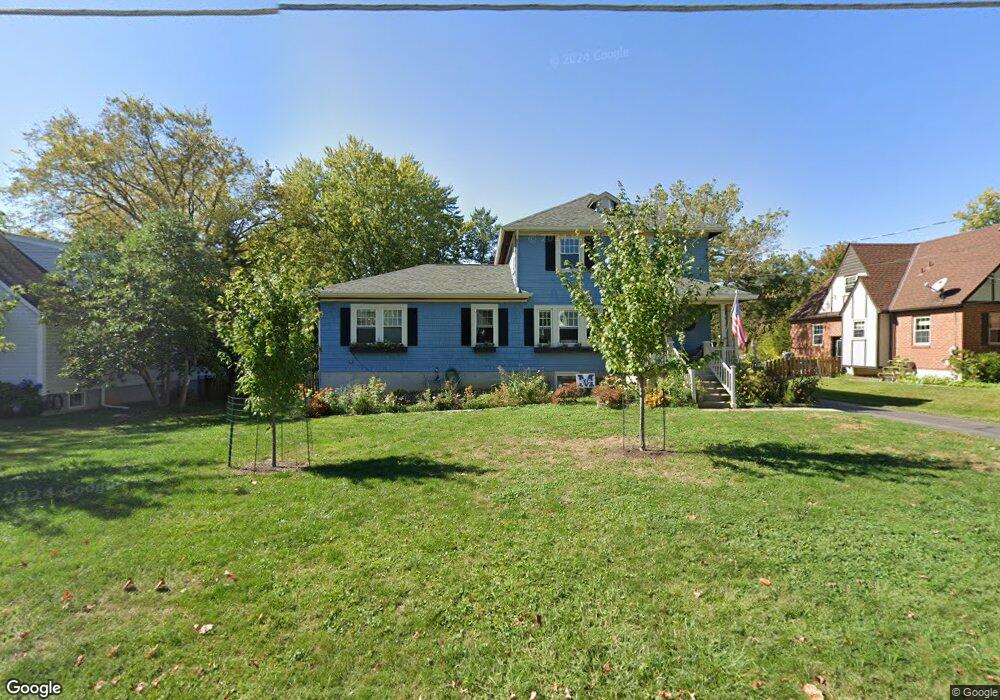
7319 Juler Ave Cincinnati, OH 45243
Estimated Value: $390,000 - $510,000
3
Beds
3
Baths
1,728
Sq Ft
$271/Sq Ft
Est. Value
About This Home
This home is located at 7319 Juler Ave, Cincinnati, OH 45243 and is currently estimated at $468,236, approximately $270 per square foot. 7319 Juler Ave is a home located in Hamilton County with nearby schools including Madeira Elementary School, Madeira Middle School, and Madeira High School.
Ownership History
Date
Name
Owned For
Owner Type
Purchase Details
Closed on
Aug 8, 2005
Sold by
Yothment James J and Yothment Elizabeth A
Bought by
Causey Jeffrey W and Causey Tracie L
Current Estimated Value
Home Financials for this Owner
Home Financials are based on the most recent Mortgage that was taken out on this home.
Original Mortgage
$167,700
Outstanding Balance
$86,034
Interest Rate
5.69%
Mortgage Type
Unknown
Estimated Equity
$382,202
Purchase Details
Closed on
Oct 26, 2001
Sold by
Ackerson Jane
Bought by
Yothment James J and Yothment Elizabeth A
Home Financials for this Owner
Home Financials are based on the most recent Mortgage that was taken out on this home.
Original Mortgage
$127,200
Interest Rate
6.8%
Create a Home Valuation Report for This Property
The Home Valuation Report is an in-depth analysis detailing your home's value as well as a comparison with similar homes in the area
Home Values in the Area
Average Home Value in this Area
Purchase History
| Date | Buyer | Sale Price | Title Company |
|---|---|---|---|
| Causey Jeffrey W | $186,400 | Advanced Land Title Agency L | |
| Yothment James J | $159,000 | -- |
Source: Public Records
Mortgage History
| Date | Status | Borrower | Loan Amount |
|---|---|---|---|
| Open | Causey Jeffrey W | $167,700 | |
| Previous Owner | Yothment James J | $127,200 |
Source: Public Records
Tax History
| Year | Tax Paid | Tax Assessment Tax Assessment Total Assessment is a certain percentage of the fair market value that is determined by local assessors to be the total taxable value of land and additions on the property. | Land | Improvement |
|---|---|---|---|---|
| 2025 | $7,723 | $131,282 | $64,757 | $66,525 |
| 2024 | $7,526 | $131,282 | $64,757 | $66,525 |
| 2023 | $7,624 | $131,282 | $64,757 | $66,525 |
| 2022 | $6,284 | $88,463 | $45,332 | $43,131 |
| 2021 | $6,152 | $88,463 | $45,332 | $43,131 |
| 2020 | $5,690 | $88,463 | $45,332 | $43,131 |
| 2019 | $5,507 | $78,985 | $40,474 | $38,511 |
| 2018 | $5,551 | $78,985 | $40,474 | $38,511 |
| 2017 | $5,265 | $78,985 | $40,474 | $38,511 |
| 2016 | $5,248 | $74,204 | $22,103 | $52,101 |
| 2015 | $4,854 | $74,204 | $22,103 | $52,101 |
| 2014 | $3,448 | $52,350 | $22,103 | $30,247 |
| 2013 | $3,283 | $48,027 | $20,279 | $27,748 |
Source: Public Records
Map
Nearby Homes
- 7231 Berwood Dr
- 7503 S Timberlane Dr
- 7156 Maple Ave
- 7831 Euclid Ave
- 7834 Laurel Ave
- 7845 Euclid Ave
- 7317 Euclid Ave
- 7133 Fowler Ave
- 7220 Mar Del Dr
- 7237 Osceola Dr
- 7817 Locust Ln
- 7321 Hosbrook Rd
- 7223 Longfield Dr
- 7334 Iuka Ave
- 7159 Hosbrook Rd
- 7151 Euclid Ave
- 7474 Dawson Rd
- 8120 Maxfield Ln
- 7300 N Mingo Ln
- 7925 Spiritwood Ct
Your Personal Tour Guide
Ask me questions while you tour the home.