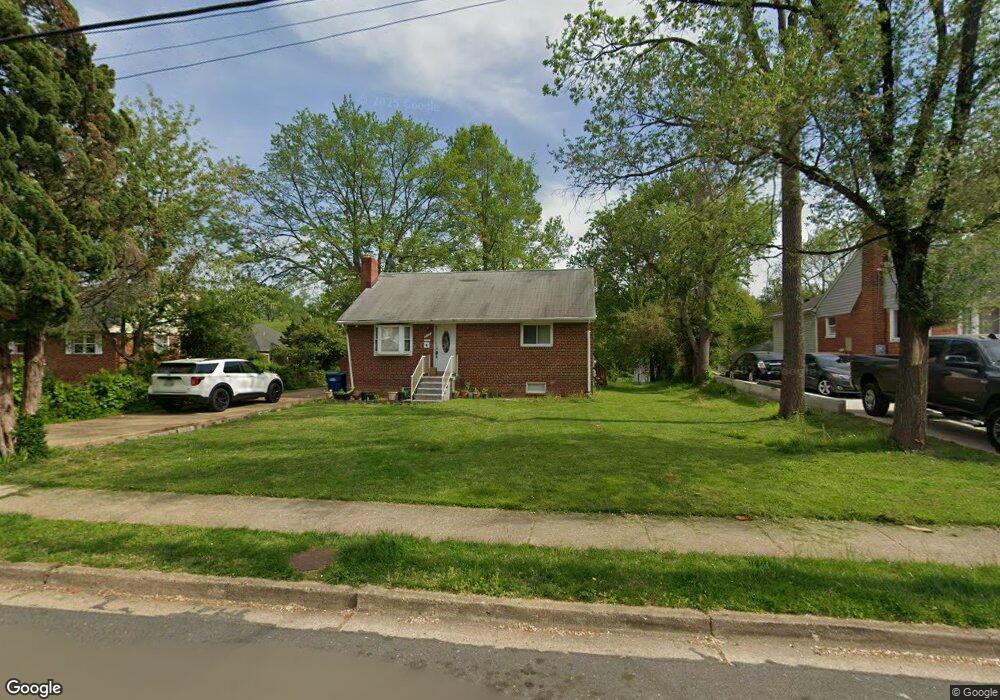
7319 Valleycrest Blvd Annandale, VA 22003
Estimated Value: $634,000 - $732,208
3
Beds
2
Baths
1,108
Sq Ft
$613/Sq Ft
Est. Value
About This Home
This home is located at 7319 Valleycrest Blvd, Annandale, VA 22003 and is currently estimated at $678,802, approximately $612 per square foot. 7319 Valleycrest Blvd is a home located in Fairfax County with nearby schools including Mason Crest Elementary School, Poe Middle School, and Falls Church High School.
Ownership History
Date
Name
Owned For
Owner Type
Purchase Details
Closed on
Aug 16, 2021
Sold by
Deramirez Hortencia Ortiz
Bought by
One Sky Properties Llc
Current Estimated Value
Purchase Details
Closed on
Sep 22, 2009
Sold by
Imb Reo Llc
Bought by
Ramirez Ortiz Laura
Purchase Details
Closed on
Jun 29, 2009
Sold by
Surety Trustees Llc Sub T
Bought by
Onewest Bank F S B
Purchase Details
Closed on
Apr 29, 2005
Sold by
Ayala Mirna S
Bought by
Baptista Alfredo
Home Financials for this Owner
Home Financials are based on the most recent Mortgage that was taken out on this home.
Original Mortgage
$404,000
Interest Rate
5.95%
Mortgage Type
New Conventional
Purchase Details
Closed on
Oct 27, 1998
Sold by
Oshea Gerald
Bought by
Duran-Rosales Ronald
Home Financials for this Owner
Home Financials are based on the most recent Mortgage that was taken out on this home.
Original Mortgage
$172,650
Interest Rate
6.68%
Create a Home Valuation Report for This Property
The Home Valuation Report is an in-depth analysis detailing your home's value as well as a comparison with similar homes in the area
Home Values in the Area
Average Home Value in this Area
Purchase History
| Date | Buyer | Sale Price | Title Company |
|---|---|---|---|
| One Sky Properties Llc | -- | None Available | |
| Ramirez Ortiz Laura | $240,000 | -- | |
| Onewest Bank F S B | $258,686 | -- | |
| Baptista Alfredo | $505,000 | -- | |
| Duran-Rosales Ronald | $178,000 | -- |
Source: Public Records
Mortgage History
| Date | Status | Borrower | Loan Amount |
|---|---|---|---|
| Previous Owner | Baptista Alfredo | $404,000 | |
| Previous Owner | Duran-Rosales Ronald | $172,650 |
Source: Public Records
Tax History Compared to Growth
Tax History
| Year | Tax Paid | Tax Assessment Tax Assessment Total Assessment is a certain percentage of the fair market value that is determined by local assessors to be the total taxable value of land and additions on the property. | Land | Improvement |
|---|---|---|---|---|
| 2025 | $7,641 | $635,030 | $290,000 | $345,030 |
| 2024 | $7,641 | $601,760 | $270,000 | $331,760 |
| 2023 | $7,239 | $591,760 | $260,000 | $331,760 |
| 2022 | $6,922 | $557,980 | $245,000 | $312,980 |
| 2021 | $6,143 | $484,450 | $205,000 | $279,450 |
| 2020 | $6,069 | $476,680 | $200,000 | $276,680 |
| 2019 | $5,795 | $452,500 | $189,000 | $263,500 |
| 2018 | $5,158 | $448,500 | $185,000 | $263,500 |
| 2017 | $5,458 | $435,500 | $172,000 | $263,500 |
| 2016 | $5,373 | $428,500 | $165,000 | $263,500 |
| 2015 | $5,101 | $420,500 | $157,000 | $263,500 |
| 2014 | $4,635 | $380,130 | $151,000 | $229,130 |
Source: Public Records
Map
Nearby Homes
- 3716 Krysia Ct
- 7406 Masonville Dr
- 7551 Marshall Dr
- 3539 Marvin St
- 7435 Mason Ln
- 7103 Valleycrest Blvd
- 3540 Ewell St
- 7508 Masonville Dr
- 3924 Lincolnshire St
- 3805 Oliver Ave
- 3422 Charleson St
- 3418 Arnold Ln
- 7504 Walnut Hill Ln
- 3405 Silver Maple Place
- 3416 Arnold Ln
- 3905 Hummer Rd
- 3507 Gallows Rd
- 7204 Quiet Cove
- 7704 Thor Dr
- 7530 Royce Ct
- 7317 Valleycrest Blvd
- 7321 Valleycrest Blvd
- 7316 Wayne Dr
- 7315 Valleycrest Blvd
- 7323 Valleycrest Blvd
- 7318 Wayne Dr
- 7314 Wayne Dr
- 7320 Wayne Dr
- 7318 Valleycrest Blvd
- 7320 Valleycrest Blvd
- 7312 Wayne Dr
- 7401 Valleycrest Blvd
- 7322 Valleycrest Blvd
- 7316 Valleycrest Blvd
- 7313 Valleycrest Blvd
- 7322 Wayne Dr
- 7324 Valleycrest Blvd
- 7314 Valleycrest Blvd
- 7313 Wayne Dr
- 7310 Wayne Dr