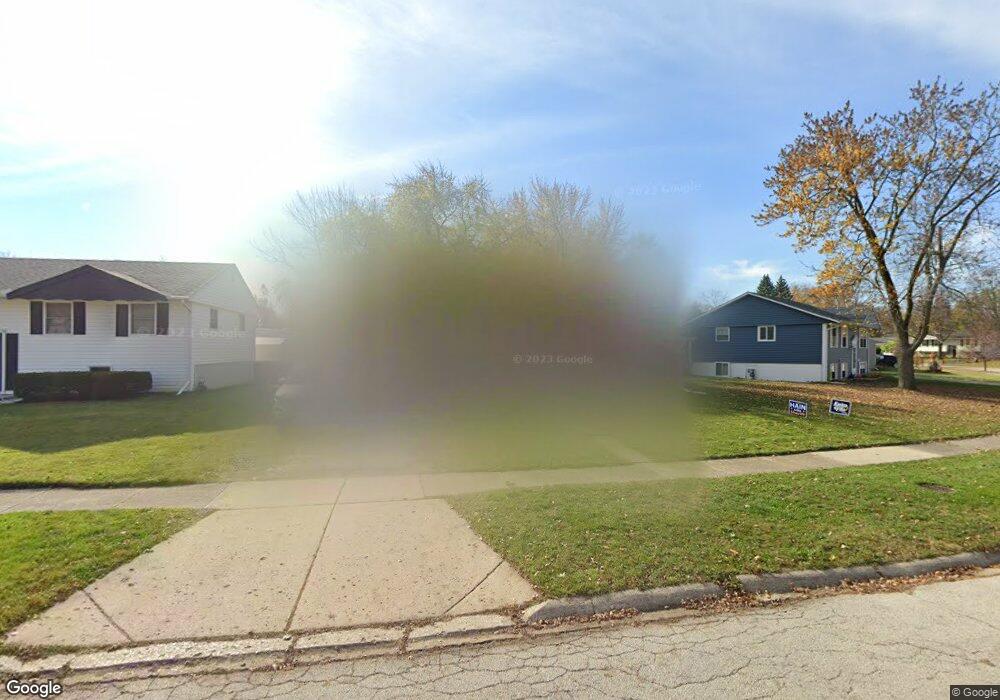
732 Calico Dr Unit 4 Aurora, IL 60506
North River NeighborhoodEstimated Value: $236,000 - $266,000
3
Beds
1
Bath
999
Sq Ft
$253/Sq Ft
Est. Value
About This Home
This home is located at 732 Calico Dr Unit 4, Aurora, IL 60506 and is currently estimated at $252,840, approximately $253 per square foot. 732 Calico Dr Unit 4 is a home located in Kane County with nearby schools including Fearn Elementary School, Jewel Middle School, and West Aurora High School.
Ownership History
Date
Name
Owned For
Owner Type
Purchase Details
Closed on
Dec 18, 2018
Sold by
Gonzalez Rodngo
Bought by
Gonzalez Rodngo and Hernandez Brenda
Current Estimated Value
Purchase Details
Closed on
May 31, 2016
Sold by
Hermandez Jorge A
Bought by
Gonzalez Rodrigo
Home Financials for this Owner
Home Financials are based on the most recent Mortgage that was taken out on this home.
Original Mortgage
$89,000
Outstanding Balance
$70,926
Interest Rate
3.61%
Mortgage Type
New Conventional
Estimated Equity
$181,914
Purchase Details
Closed on
Oct 13, 1999
Sold by
Ochoa Meregildo G and Ochoa Maria T
Bought by
Hernandez Jorge A and Hernandez Rosa E
Home Financials for this Owner
Home Financials are based on the most recent Mortgage that was taken out on this home.
Original Mortgage
$95,853
Interest Rate
7.91%
Mortgage Type
FHA
Create a Home Valuation Report for This Property
The Home Valuation Report is an in-depth analysis detailing your home's value as well as a comparison with similar homes in the area
Home Values in the Area
Average Home Value in this Area
Purchase History
| Date | Buyer | Sale Price | Title Company |
|---|---|---|---|
| Gonzalez Rodngo | -- | Attorney | |
| Gonzalez Rodrigo | $95,000 | First American Title | |
| Hernandez Jorge A | $96,000 | First American Title Ins Co |
Source: Public Records
Mortgage History
| Date | Status | Borrower | Loan Amount |
|---|---|---|---|
| Open | Gonzalez Rodrigo | $89,000 | |
| Previous Owner | Hernandez Jorge A | $95,853 |
Source: Public Records
Tax History
| Year | Tax Paid | Tax Assessment Tax Assessment Total Assessment is a certain percentage of the fair market value that is determined by local assessors to be the total taxable value of land and additions on the property. | Land | Improvement |
|---|---|---|---|---|
| 2024 | $5,096 | $72,362 | $13,260 | $59,102 |
| 2023 | $4,853 | $64,655 | $11,848 | $52,807 |
| 2022 | $4,691 | $58,992 | $10,810 | $48,182 |
| 2021 | $4,470 | $54,922 | $10,064 | $44,858 |
| 2020 | $4,968 | $59,070 | $9,348 | $49,722 |
| 2019 | $4,765 | $54,730 | $8,661 | $46,069 |
| 2018 | $4,315 | $49,120 | $8,011 | $41,109 |
| 2017 | $4,008 | $44,941 | $7,381 | $37,560 |
| 2016 | $3,906 | $36,772 | $6,327 | $30,445 |
| 2015 | -- | $32,090 | $5,441 | $26,649 |
| 2014 | -- | $29,979 | $5,233 | $24,746 |
| 2013 | -- | $31,294 | $5,158 | $26,136 |
Source: Public Records
Map
Nearby Homes
- 1403 Black Oak Trail
- 461 Sullivan Rd
- 742 Cedardale Place Unit 2
- 1337 Eastwood Dr
- 900 Old Indian Trail
- 28 S Willow Way
- 509 N Park Ave
- 208 W State St
- 307 Hill Ave
- 847 Foran Ln
- 10 S Grant St
- 377 Florida Ave
- 1480 Colorado Ave
- 355 Lawndale Ave
- 732 N Fordham Ave
- 317 Hidden Creek Ln Unit 317
- 1317 Monomoy St Unit E
- 833 N Randall Rd Unit C4
- 14-18 N Lake St
- 418 W Illinois Ave
- 726 Calico Dr
- 738 Calico Dr Unit 5
- 720 Calico Dr
- 725 Springbrook Dr
- 1565 Sandy Ln
- 1546 Hollycrest Ave Unit 4
- 721 Springbrook Dr
- 716 Calico Dr
- 731 Calico Dr
- 1555 Sandy Ln Unit 5
- 737 Calico Dr Unit 5
- 727 Calico Dr
- 741 Calico Dr
- 715 Springbrook Dr
- 721 Calico Dr
- 1549 Sandy Ln Unit 5
- 1542 Hollycrest Ave Unit 4
- 747 Calico Dr
- 710 Calico Dr
- 717 Calico Dr
Your Personal Tour Guide
Ask me questions while you tour the home.