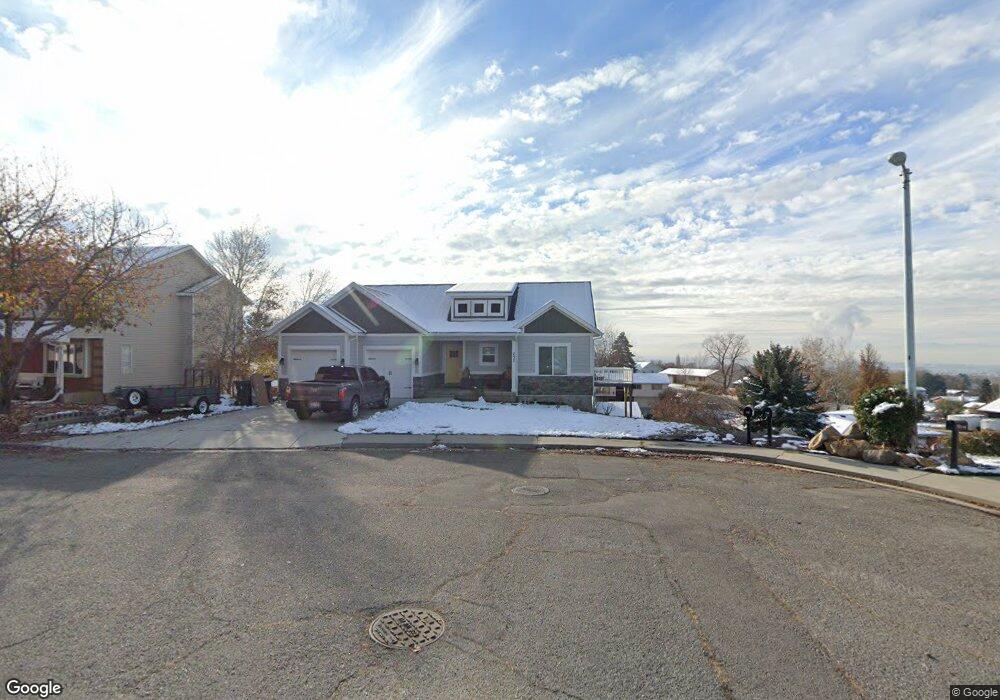
732 E 1000 N Unit 21 Pleasant Grove, UT 84062
Estimated Value: $679,000 - $871,000
2
Beds
3
Baths
1,399
Sq Ft
$551/Sq Ft
Est. Value
About This Home
This home is located at 732 E 1000 N Unit 21, Pleasant Grove, UT 84062 and is currently estimated at $770,303, approximately $550 per square foot. 732 E 1000 N Unit 21 is a home located in Utah County with nearby schools including Grovecrest Elementary School, Pleasant Grove Junior High School, and Pleasant Grove High School.
Ownership History
Date
Name
Owned For
Owner Type
Purchase Details
Closed on
Oct 3, 2016
Sold by
Huckleberry Homes Inc
Bought by
Taylor Mathew L
Current Estimated Value
Home Financials for this Owner
Home Financials are based on the most recent Mortgage that was taken out on this home.
Original Mortgage
$381,185
Outstanding Balance
$305,300
Interest Rate
3.43%
Mortgage Type
New Conventional
Estimated Equity
$465,003
Purchase Details
Closed on
Jan 29, 2015
Sold by
Larsen Terry and Terry Larsen Living Trust
Bought by
Huckleberry Homes Inc
Create a Home Valuation Report for This Property
The Home Valuation Report is an in-depth analysis detailing your home's value as well as a comparison with similar homes in the area
Home Values in the Area
Average Home Value in this Area
Purchase History
| Date | Buyer | Sale Price | Title Company |
|---|---|---|---|
| Taylor Mathew L | -- | Meridian Title Co | |
| Huckleberry Homes Inc | -- | Meridian Title Co |
Source: Public Records
Mortgage History
| Date | Status | Borrower | Loan Amount |
|---|---|---|---|
| Open | Taylor Mathew L | $381,185 |
Source: Public Records
Tax History Compared to Growth
Tax History
| Year | Tax Paid | Tax Assessment Tax Assessment Total Assessment is a certain percentage of the fair market value that is determined by local assessors to be the total taxable value of land and additions on the property. | Land | Improvement |
|---|---|---|---|---|
| 2025 | $3,412 | $419,980 | -- | -- |
| 2024 | $3,412 | $398,200 | $0 | $0 |
| 2023 | $3,323 | $406,010 | $0 | $0 |
| 2022 | $3,143 | $382,030 | $0 | $0 |
| 2021 | $2,883 | $533,700 | $158,600 | $375,100 |
| 2020 | $2,643 | $479,500 | $141,600 | $337,900 |
| 2019 | $2,433 | $456,600 | $134,500 | $322,100 |
| 2018 | $2,384 | $423,000 | $127,400 | $295,600 |
| 2017 | $2,189 | $206,745 | $0 | $0 |
| 2016 | -- | $85,000 | $0 | $0 |
| 2015 | $984 | $85,000 | $0 | $0 |
Source: Public Records
Map
Nearby Homes