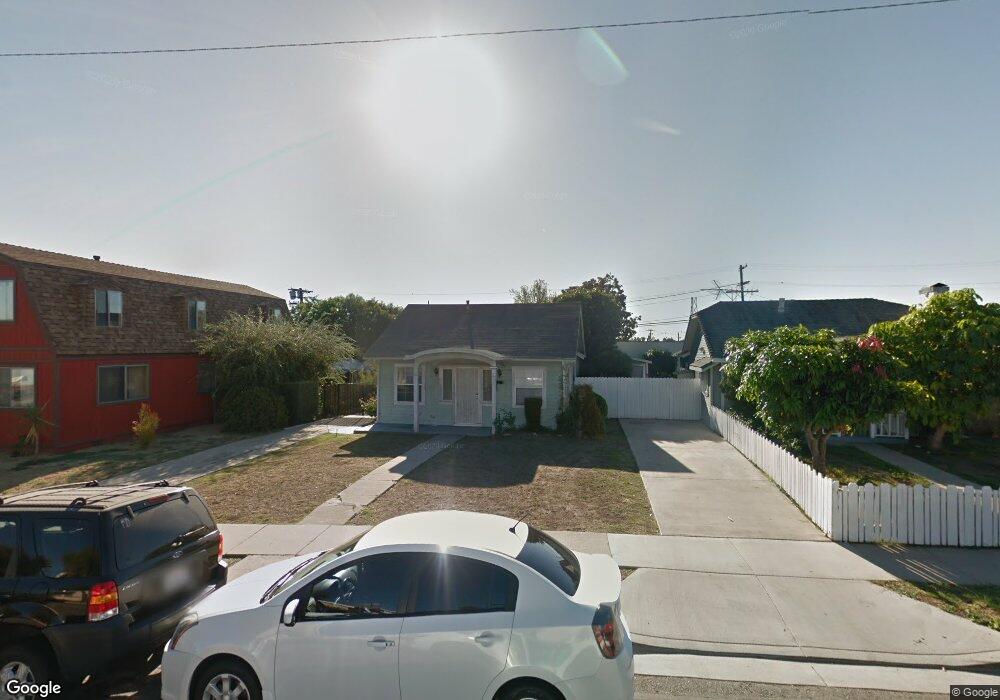
732 E Brett St Inglewood, CA 90302
North Inglewood NeighborhoodEstimated Value: $481,000 - $639,574
2
Beds
1
Bath
824
Sq Ft
$649/Sq Ft
Est. Value
About This Home
This home is located at 732 E Brett St, Inglewood, CA 90302 and is currently estimated at $534,394, approximately $648 per square foot. 732 E Brett St is a home located in Los Angeles County with nearby schools including Centinela Elementary School, Crozier (George W.) Middle School, and Inglewood High School.
Ownership History
Date
Name
Owned For
Owner Type
Purchase Details
Closed on
Oct 22, 2025
Sold by
Angel Maria Refugio Urena
Bought by
Angel Jose Gabriel
Current Estimated Value
Home Financials for this Owner
Home Financials are based on the most recent Mortgage that was taken out on this home.
Original Mortgage
$476,215
Outstanding Balance
$474,858
Interest Rate
6.27%
Mortgage Type
FHA
Estimated Equity
$59,536
Purchase Details
Closed on
Oct 16, 2025
Sold by
Willie And Matteal Kirby Family Trust and Kirby Kimberly L
Bought by
Gonzalez Lilia and Angel Jose Gabriel
Home Financials for this Owner
Home Financials are based on the most recent Mortgage that was taken out on this home.
Original Mortgage
$476,215
Outstanding Balance
$474,858
Interest Rate
6.27%
Mortgage Type
FHA
Estimated Equity
$59,536
Purchase Details
Closed on
Sep 25, 1997
Sold by
Kirby Willie
Bought by
Kirby Willie and Kirby Matteal J
Purchase Details
Closed on
Jun 2, 1997
Sold by
Graham Madeline M
Bought by
Kirby Willie and Kirby Matteal J
Create a Home Valuation Report for This Property
The Home Valuation Report is an in-depth analysis detailing your home's value as well as a comparison with similar homes in the area
Home Values in the Area
Average Home Value in this Area
Purchase History
| Date | Buyer | Sale Price | Title Company |
|---|---|---|---|
| Angel Jose Gabriel | -- | Priority Title | |
| Gonzalez Lilia | $485,000 | Priority Title | |
| Kirby Willie | -- | -- | |
| Kirby Willie | $70,000 | First American Title Co |
Source: Public Records
Mortgage History
| Date | Status | Borrower | Loan Amount |
|---|---|---|---|
| Open | Angel Jose Gabriel | $476,215 |
Source: Public Records
Tax History
| Year | Tax Paid | Tax Assessment Tax Assessment Total Assessment is a certain percentage of the fair market value that is determined by local assessors to be the total taxable value of land and additions on the property. | Land | Improvement |
|---|---|---|---|---|
| 2025 | $2,620 | $180,752 | $122,133 | $58,619 |
| 2024 | $2,620 | $177,209 | $119,739 | $57,470 |
| 2023 | $2,596 | $173,736 | $117,392 | $56,344 |
| 2022 | $2,638 | $170,331 | $115,091 | $55,240 |
| 2021 | $2,614 | $166,992 | $112,835 | $54,157 |
| 2019 | $2,468 | $162,041 | $109,490 | $52,551 |
| 2018 | $2,429 | $158,865 | $107,344 | $51,521 |
| 2016 | $2,303 | $152,698 | $103,177 | $49,521 |
| 2015 | $2,281 | $150,406 | $101,628 | $48,778 |
| 2014 | $2,284 | $147,461 | $99,638 | $47,823 |
Source: Public Records
Map
Nearby Homes
- 1109 N Chester Ave
- 1118 Marlborough Ave
- 924 N Chester Ave
- 642 E Fairview Blvd Unit A
- 642 E Fairview Blvd Unit B
- 642 E Fairview Blvd Unit C
- 612 E Fairview Blvd
- 711 Stepney St
- 582 E 67th St
- 6312 S Verdun Ave
- 6318 Eileen Ave
- 6303 Eileen Ave
- 563 E Hazel St Unit 6
- 916 E 68th St
- 540 E Hyde Park Place
- 534 Hyde Park Place
- 1008 Long St
- 1108 E Fairview Blvd
- 506 E Brett St
- 6325 Long St
- 1115 N Park Ave
- 728 E Brett St
- 724 E Brett St
- 735 E Hyde Park Blvd
- 1201 N Park Ave
- 800 E Brett St
- 718 E Brett St
- 1205 N Park Ave
- 801 E Hyde Park Blvd
- 804 E Brett St
- 716 E Brett St
- 1207 N Park Ave
- 715 E Brett St
- 808 E Brett St
- 723 E Hyde Park Blvd
- 712 E Brett St
- 1211 N Park Ave
- 711 E Brett St
- 810 E Brett St
- 807 E Brett St
Your Personal Tour Guide
Ask me questions while you tour the home.