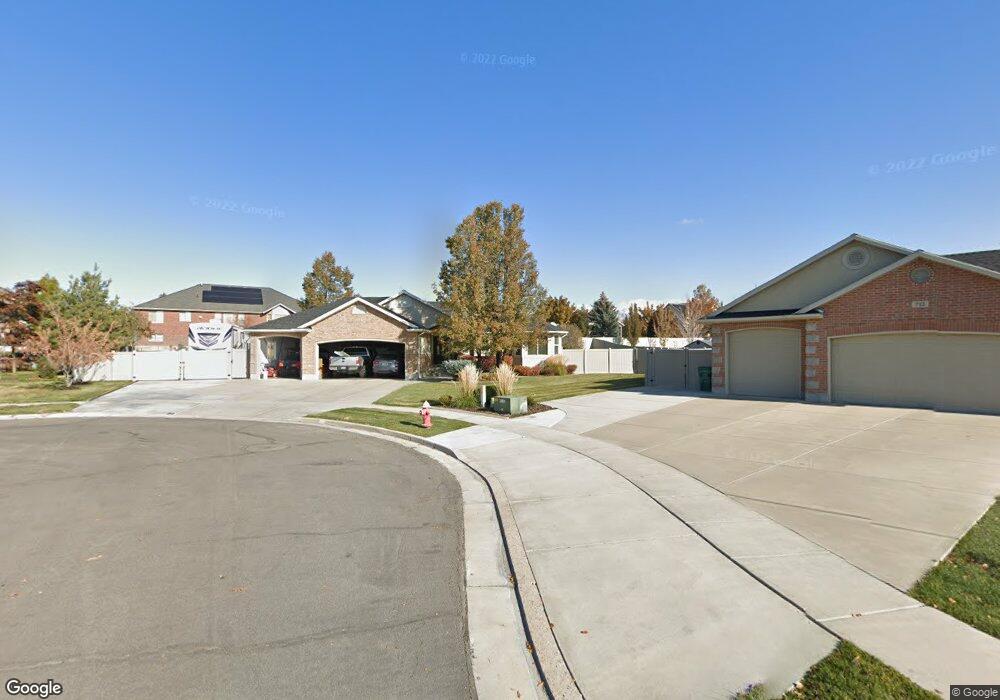
732 N 2375 W Layton, UT 84041
Estimated Value: $601,000 - $710,571
3
Beds
2
Baths
1,806
Sq Ft
$372/Sq Ft
Est. Value
About This Home
This home is located at 732 N 2375 W, Layton, UT 84041 and is currently estimated at $672,393, approximately $372 per square foot. 732 N 2375 W is a home located in Davis County with nearby schools including Ellison Park School, Shoreline Junior High School, and Layton High School.
Ownership History
Date
Name
Owned For
Owner Type
Purchase Details
Closed on
Jan 7, 2022
Sold by
Jesse Sheryl L and The Sheryl Louise Jesse Revoca
Bought by
Jesse William R and Jesse Sheryl L
Current Estimated Value
Purchase Details
Closed on
Nov 9, 2020
Sold by
Jesse William and Jesse Sheryl L
Bought by
Jesse Sheryl L and Jesse Louise Sheryl
Home Financials for this Owner
Home Financials are based on the most recent Mortgage that was taken out on this home.
Original Mortgage
$216,000
Interest Rate
2.8%
Mortgage Type
New Conventional
Purchase Details
Closed on
Mar 12, 2019
Sold by
Jesse William R and Jesse Sheryl L
Bought by
Jesse Sheryl L and The Sheryl Louise Jesse Revoca
Purchase Details
Closed on
May 28, 2004
Sold by
L Dale Green Construction Inc
Bought by
Jesse William R and Jesse Sheryl L
Home Financials for this Owner
Home Financials are based on the most recent Mortgage that was taken out on this home.
Original Mortgage
$200,000
Interest Rate
5.92%
Mortgage Type
Purchase Money Mortgage
Create a Home Valuation Report for This Property
The Home Valuation Report is an in-depth analysis detailing your home's value as well as a comparison with similar homes in the area
Home Values in the Area
Average Home Value in this Area
Purchase History
| Date | Buyer | Sale Price | Title Company |
|---|---|---|---|
| Jesse William R | -- | None Available | |
| Jesse Family Revocable Living Trust | -- | None Listed On Document | |
| Jesse Sheryl L | -- | Gt Title Services | |
| Jesse William | -- | Gt Title Services S | |
| Jesse Sheryl L | -- | None Available | |
| Jesse William R | -- | Security Title Company |
Source: Public Records
Mortgage History
| Date | Status | Borrower | Loan Amount |
|---|---|---|---|
| Previous Owner | Jesse William | $216,000 | |
| Previous Owner | Jesse William R | $200,000 | |
| Closed | Jesse William R | $25,000 |
Source: Public Records
Tax History
| Year | Tax Paid | Tax Assessment Tax Assessment Total Assessment is a certain percentage of the fair market value that is determined by local assessors to be the total taxable value of land and additions on the property. | Land | Improvement |
|---|---|---|---|---|
| 2025 | $3,526 | $370,150 | $178,375 | $191,775 |
| 2024 | $3,573 | $377,850 | $182,145 | $195,705 |
| 2023 | $3,487 | $650,000 | $211,893 | $438,107 |
| 2022 | $3,684 | $372,900 | $111,289 | $261,611 |
| 2021 | $3,332 | $503,000 | $166,819 | $336,181 |
| 2020 | $3,038 | $440,000 | $145,771 | $294,229 |
| 2019 | $2,933 | $416,000 | $136,253 | $279,747 |
| 2018 | $2,725 | $388,000 | $120,926 | $267,074 |
| 2016 | $2,544 | $186,835 | $54,507 | $132,328 |
| 2015 | $2,526 | $176,165 | $54,507 | $121,658 |
| 2014 | $2,098 | $149,581 | $54,507 | $95,074 |
| 2013 | -- | $160,079 | $41,830 | $118,249 |
Source: Public Records
Map
Nearby Homes
- 816 N 2175 W
- 867 N 2125 W
- 816 N 2700 W
- 1999 W 850 N
- 1141 N 2275 W
- 1998 W 900 N
- 1976 W 850 N
- 1186 N 2425 W
- 2646 W 1125 N
- 979 Cold Creek Way
- 2144 W 1275 N
- 1229 N 2025 W
- 1211 N 1875 W Unit 211
- 1211 N 1875 W
- 1227 N 1875 W
- 1227 N 1875 W Unit 213
- 1235 N 1875 W Unit 214
- 1235 N 1875 W
- 1452 N 1875 W Unit 146
- 1250 N 2925 W
Your Personal Tour Guide
Ask me questions while you tour the home.