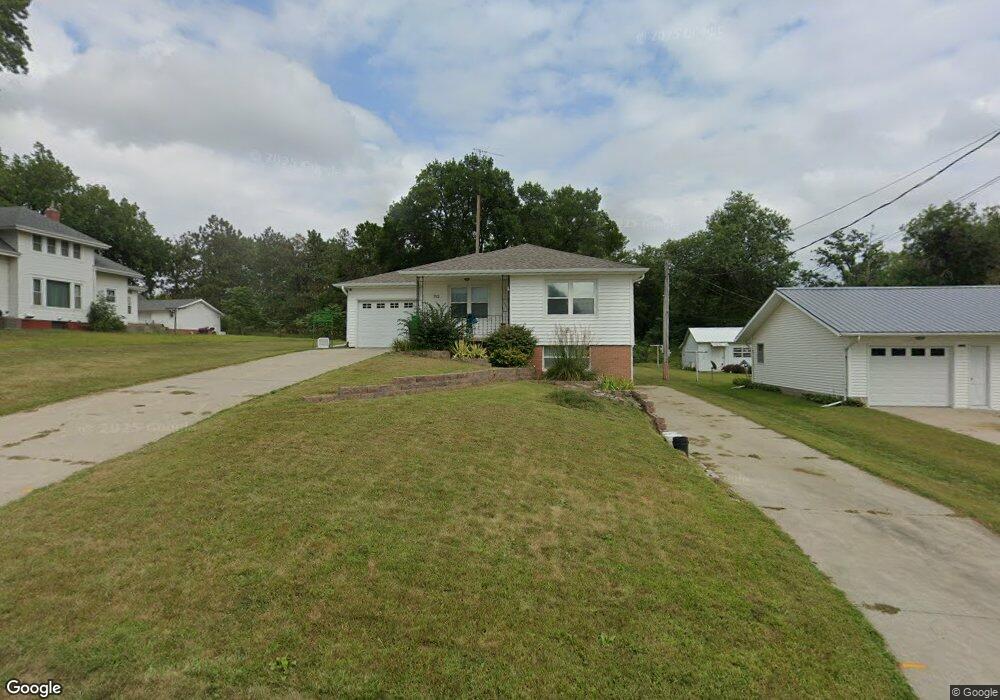
732 N Colfax St West Point, NE 68788
Estimated Value: $161,000 - $267,000
2
Beds
2
Baths
1,044
Sq Ft
$188/Sq Ft
Est. Value
About This Home
This home is located at 732 N Colfax St, West Point, NE 68788 and is currently estimated at $195,885, approximately $187 per square foot. 732 N Colfax St is a home located in Cuming County with nearby schools including West Point-Beemer Junior/Senior High School, Guardian Angels Elementary School, and St. Paul Lutheran School.
Ownership History
Date
Name
Owned For
Owner Type
Purchase Details
Closed on
Jul 31, 2013
Sold by
Mandel Christopher R and Mandel Marie N
Bought by
Gerken Stella
Current Estimated Value
Home Financials for this Owner
Home Financials are based on the most recent Mortgage that was taken out on this home.
Original Mortgage
$32,000
Outstanding Balance
$23,354
Interest Rate
3.93%
Mortgage Type
Future Advance Clause Open End Mortgage
Estimated Equity
$172,531
Purchase Details
Closed on
Mar 1, 2005
Sold by
Zobel Robert and Zobel Gene
Bought by
Mandel Christopher R and Mandel Marie N
Home Financials for this Owner
Home Financials are based on the most recent Mortgage that was taken out on this home.
Original Mortgage
$57,600
Interest Rate
5.71%
Mortgage Type
New Conventional
Create a Home Valuation Report for This Property
The Home Valuation Report is an in-depth analysis detailing your home's value as well as a comparison with similar homes in the area
Home Values in the Area
Average Home Value in this Area
Purchase History
| Date | Buyer | Sale Price | Title Company |
|---|---|---|---|
| Gerken Stella | $80,000 | None Available | |
| Mandel Christopher R | $56,000 | -- |
Source: Public Records
Mortgage History
| Date | Status | Borrower | Loan Amount |
|---|---|---|---|
| Open | Gerken Stella | $32,000 | |
| Previous Owner | Mandel Christopher R | $57,600 |
Source: Public Records
Tax History Compared to Growth
Tax History
| Year | Tax Paid | Tax Assessment Tax Assessment Total Assessment is a certain percentage of the fair market value that is determined by local assessors to be the total taxable value of land and additions on the property. | Land | Improvement |
|---|---|---|---|---|
| 2024 | $1,179 | $139,095 | $17,350 | $121,745 |
| 2023 | $1,532 | $132,790 | $15,330 | $117,460 |
| 2022 | $1,488 | $117,650 | $12,105 | $105,545 |
| 2021 | $1,373 | $103,035 | $10,090 | $92,945 |
| 2020 | $1,303 | $97,565 | $10,090 | $87,475 |
| 2019 | $1,272 | $93,095 | $10,090 | $83,005 |
| 2018 | $1,174 | $85,525 | $10,090 | $75,435 |
| 2017 | $1,200 | $85,525 | $10,090 | $75,435 |
| 2016 | $1,192 | $82,510 | $10,090 | $72,420 |
| 2015 | $1,268 | $82,510 | $10,090 | $72,420 |
| 2014 | $1,314 | $74,070 | $10,090 | $63,980 |
| 2013 | $1,314 | $74,070 | $10,090 | $63,980 |
Source: Public Records
Map
Nearby Homes
- 1207 N Main St
- 208 N Lincoln St
- 819 Cornhusker Dr
- 1402 E Bridge St
- 219 S Monitor St
- 749 E Grove St
- 420 S Farragut St
- 1045 E Grove St
- 205 E Sheridan St
- 626 S Monitor St
- 771 E Willow St
- 741 S Niphon St
- 301 W Pine St
- 402 W Pine St
- 808 18th Rd
- 1493 U S 275
- 2235 K Rd
- 1043 23rd Rd
- 112 Par Acres Dr Unit 4
- 2416 F Rd
- 722 N Colfax St
- 242 E Coburn St
- 243 E Coburn St
- 704 N Colfax St
- 328 E Neligh St
- 812 N Colfax St
- 246 E Neligh St
- 441 N Colfax St
- 830 N Colfax St
- 240 E Coburn St
- 233 E Coburn St
- 233 E Coburn St
- 718 N Lincoln St
- 646 N Colfax St
- 226 E Coburn St
- 230 E Neligh St
- 329 E Neligh St
- 641 N Colfax St
- 622 N Colfax St
- 622 N Colfax St