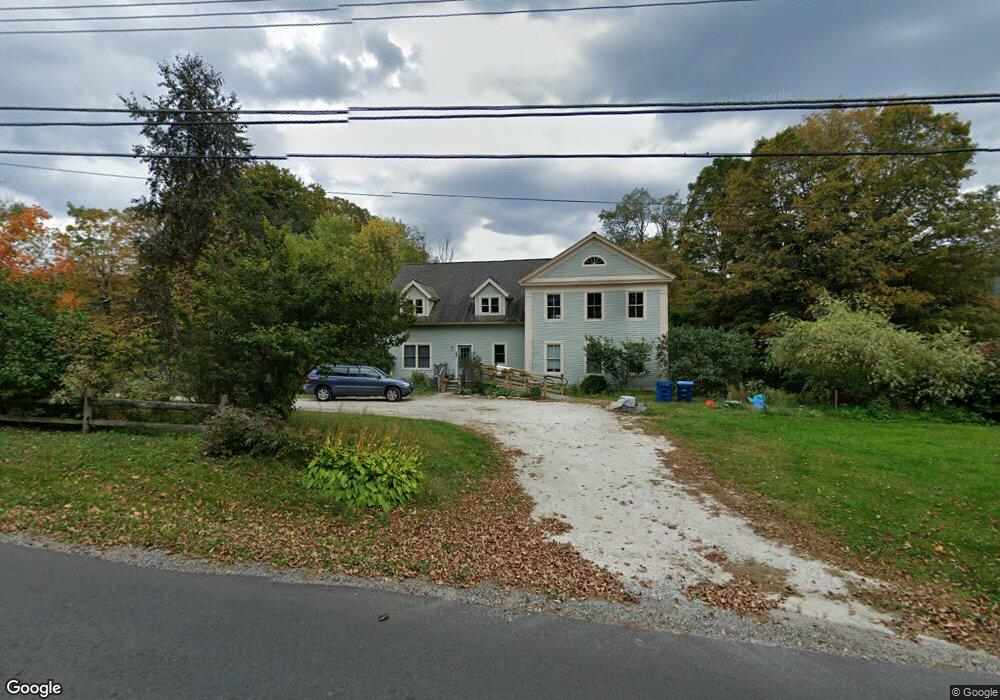
732 N Main St Lanesborough, MA 01237
Estimated Value: $637,000 - $719,000
5
Beds
2
Baths
1,680
Sq Ft
$407/Sq Ft
Est. Value
About This Home
This home is located at 732 N Main St, Lanesborough, MA 01237 and is currently estimated at $683,539, approximately $406 per square foot. 732 N Main St is a home located in Berkshire County with nearby schools including Lanesborough Elementary School and Mt. Greylock Regional High School.
Ownership History
Date
Name
Owned For
Owner Type
Purchase Details
Closed on
Jun 26, 1998
Sold by
Hatch Raymund G and Hatch Rosemary J
Bought by
Cohen Richard E and Sacks Cheryl R
Current Estimated Value
Home Financials for this Owner
Home Financials are based on the most recent Mortgage that was taken out on this home.
Original Mortgage
$110,000
Interest Rate
7.09%
Mortgage Type
Purchase Money Mortgage
Create a Home Valuation Report for This Property
The Home Valuation Report is an in-depth analysis detailing your home's value as well as a comparison with similar homes in the area
Home Values in the Area
Average Home Value in this Area
Purchase History
| Date | Buyer | Sale Price | Title Company |
|---|---|---|---|
| Cohen Richard E | $137,500 | -- |
Source: Public Records
Mortgage History
| Date | Status | Borrower | Loan Amount |
|---|---|---|---|
| Open | Cohen Richard E | $225,000 | |
| Closed | Cohen Richard E | $87,819 | |
| Closed | Cohen Richard E | $110,000 | |
| Previous Owner | Cohen Richard E | $60,000 |
Source: Public Records
Tax History Compared to Growth
Tax History
| Year | Tax Paid | Tax Assessment Tax Assessment Total Assessment is a certain percentage of the fair market value that is determined by local assessors to be the total taxable value of land and additions on the property. | Land | Improvement |
|---|---|---|---|---|
| 2025 | $8,877 | $530,600 | $78,900 | $451,700 |
| 2024 | $7,959 | $467,900 | $75,200 | $392,700 |
| 2023 | $8,293 | $469,300 | $75,200 | $394,100 |
| 2022 | $8,192 | $428,900 | $75,200 | $353,700 |
| 2021 | $8,096 | $399,200 | $75,200 | $324,000 |
| 2020 | $7,887 | $381,400 | $71,700 | $309,700 |
| 2019 | $8,086 | $357,300 | $71,700 | $285,600 |
| 2018 | $7,646 | $357,300 | $71,700 | $285,600 |
| 2017 | $7,368 | $352,700 | $66,700 | $286,000 |
| 2016 | $8,925 | $461,000 | $65,800 | $395,200 |
| 2015 | $8,689 | $457,800 | $65,800 | $392,000 |
Source: Public Records
Map
Nearby Homes
- 5 Victoria Ln
- 0 Bailey Rd
- 66 Scott Rd
- 4 Upper Rd
- 40 Silver St
- 350 Old Cheshire Rd
- 40 Curran Rd
- 112 Silver St
- 192 Curran Rd
- 18 Billings St
- 0 Goodell Rd
- 230 Curran Rd
- 20 Westview Rd
- 60 Old Cheshire Rd
- 136 Ingalls Rd
- 775 Williamstown Rd
- 71 Miner Lots 2 and 3 Rd
- 83 Devonshire Dr
- 0 Old Ore Bed Rd Unit 246231
- 0 Old Ore Bed Rd Unit 246230