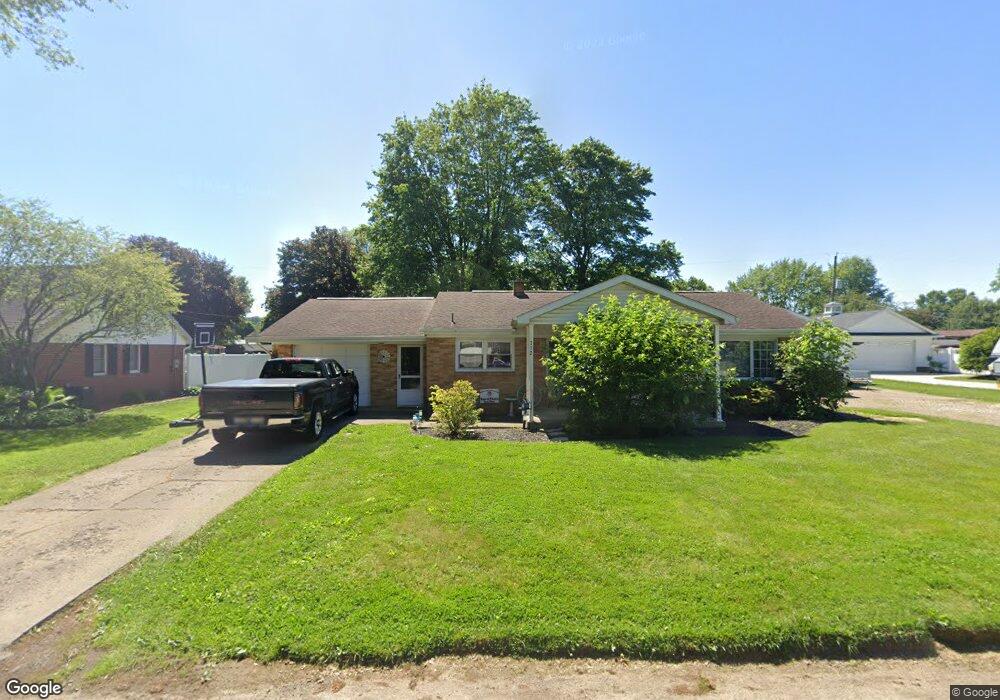
732 Oak Ave SW Strasburg, OH 44680
Estimated Value: $231,000 - $303,000
3
Beds
2
Baths
1,120
Sq Ft
$229/Sq Ft
Est. Value
About This Home
This home is located at 732 Oak Ave SW, Strasburg, OH 44680 and is currently estimated at $256,598, approximately $229 per square foot. 732 Oak Ave SW is a home located in Tuscarawas County with nearby schools including Strasburg-Franklin Elementary School and Strasburg-Franklin High School.
Ownership History
Date
Name
Owned For
Owner Type
Purchase Details
Closed on
Dec 2, 2010
Sold by
Bender Gregory
Bought by
Bender Gregory R and The Gregory R Bender Revcable Trust
Current Estimated Value
Purchase Details
Closed on
Feb 1, 2007
Sold by
Conner Allen B and Conner Cynthia L
Bought by
Bender Gregory
Home Financials for this Owner
Home Financials are based on the most recent Mortgage that was taken out on this home.
Original Mortgage
$118,000
Outstanding Balance
$70,795
Interest Rate
6.19%
Mortgage Type
Purchase Money Mortgage
Estimated Equity
$185,803
Purchase Details
Closed on
Feb 18, 1997
Sold by
Boylan John D
Bought by
Conner Allen B and Conner Cynthia L
Home Financials for this Owner
Home Financials are based on the most recent Mortgage that was taken out on this home.
Original Mortgage
$76,000
Interest Rate
8.5%
Mortgage Type
New Conventional
Purchase Details
Closed on
Mar 24, 1987
Bought by
Bender Gregory R
Create a Home Valuation Report for This Property
The Home Valuation Report is an in-depth analysis detailing your home's value as well as a comparison with similar homes in the area
Home Values in the Area
Average Home Value in this Area
Purchase History
| Date | Buyer | Sale Price | Title Company |
|---|---|---|---|
| Bender Gregory R | -- | Attorney | |
| Bender Gregory | $124,250 | Attorney | |
| Conner Allen B | $95,500 | -- | |
| Bender Gregory R | $55,000 | -- |
Source: Public Records
Mortgage History
| Date | Status | Borrower | Loan Amount |
|---|---|---|---|
| Open | Bender Gregory | $118,000 | |
| Previous Owner | Conner Allen B | $76,000 |
Source: Public Records
Tax History Compared to Growth
Tax History
| Year | Tax Paid | Tax Assessment Tax Assessment Total Assessment is a certain percentage of the fair market value that is determined by local assessors to be the total taxable value of land and additions on the property. | Land | Improvement |
|---|---|---|---|---|
| 2024 | $2,349 | $59,060 | $12,020 | $47,040 |
| 2023 | $2,349 | $168,750 | $34,350 | $134,400 |
| 2022 | $2,263 | $59,063 | $12,023 | $47,040 |
| 2021 | $2,067 | $50,687 | $10,528 | $40,159 |
| 2020 | $1,951 | $50,687 | $10,528 | $40,159 |
| 2019 | $1,959 | $50,687 | $10,528 | $40,159 |
| 2018 | $1,844 | $45,210 | $9,390 | $35,820 |
| 2017 | $1,852 | $45,210 | $9,390 | $35,820 |
| 2016 | $1,852 | $45,210 | $9,390 | $35,820 |
| 2014 | $1,786 | $42,360 | $8,900 | $33,460 |
| 2013 | $1,753 | $42,360 | $8,900 | $33,460 |
Source: Public Records
Map
Nearby Homes
- 433 9th St SW
- 602 S Bodmer Ave
- 143 2nd St SE
- 7500 Central Rd NW
- 0 Dundee Strasburg Rd NW
- 3203 Mount Pleasant Rd
- 0 7th St NW
- 713 Dale Ave NW
- 6269 Columbia Rd NW
- 0 State Route 250 NW Unit 5161477
- 0 Cherry Run Rd NW
- 5742 Hilltop Dr NW
- 6650 Saint Peters Church Rd NW
- 6238 Saint Peters Church Rd NW
- 5181 State Route 516 NW
- 1296 Russell Dr NW
- 4029 Minard Rd NW
- 0 Swonger Rd Unit 5161456
- 0 Swonger Rd Unit 5161457
- 0 Bair Rd NW Unit 5124469
- 740 Oak Ave SW
- 716 Oak Ave SW
- 725 Oak Ave SW
- 733 Kaderly Ave
- 741 Kaderly Ave
- 741 Oak Ave SW
- 729 Kaderly Ave
- 708 7th St SW
- 808 Oak Ave SW
- 709 Oak Ave SW
- 546 7th St SW
- 809 Kaderly Ave
- 809 Oak Ave SW
- 441 8th St SW
- 448 7th St SW
- 817 Kaderly Ave
- 816 Oak Ave SW
- 732 Kaderly Ave
- 724 Kaderly Ave
- 817 Oak Ave SW