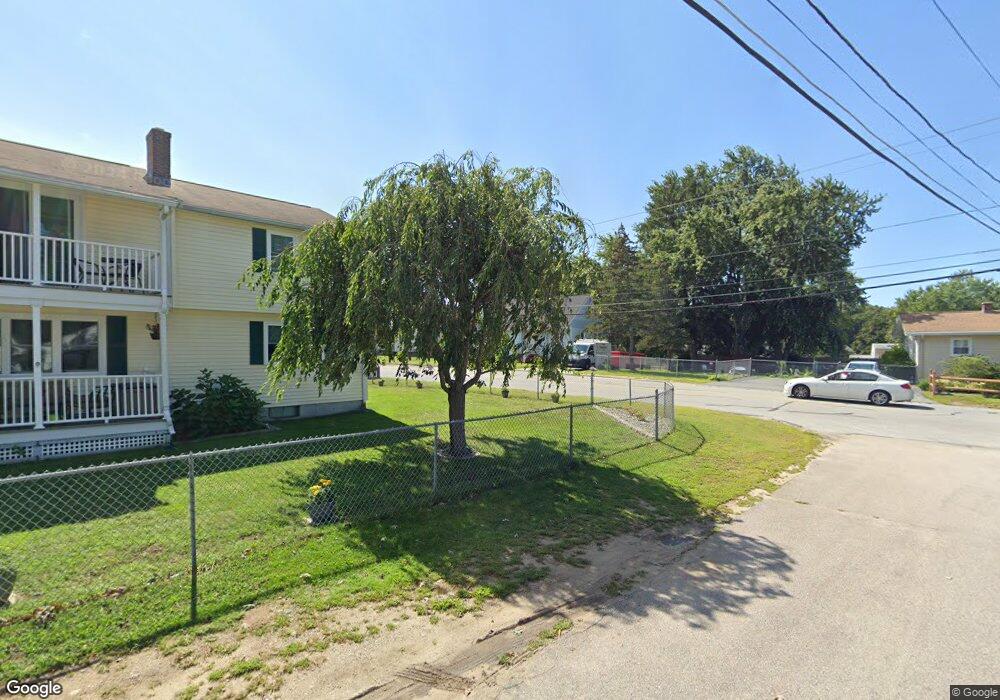
732 Rathbun St Blackstone, MA 01504
Estimated Value: $418,000 - $445,000
3
Beds
1
Bath
1,068
Sq Ft
$405/Sq Ft
Est. Value
About This Home
This home is located at 732 Rathbun St, Blackstone, MA 01504 and is currently estimated at $432,703, approximately $405 per square foot. 732 Rathbun St is a home located in Worcester County with nearby schools including Blackstone-Millville Regional High School, Rise Prep Mayoral Academy Middle School, and Rise Prep Mayoral Academy.
Ownership History
Date
Name
Owned For
Owner Type
Purchase Details
Closed on
Jul 2, 2002
Sold by
Griffin Wayne H and Griffin Virginia C
Bought by
Wians Scott and Ewing Janet
Current Estimated Value
Home Financials for this Owner
Home Financials are based on the most recent Mortgage that was taken out on this home.
Original Mortgage
$208,000
Outstanding Balance
$89,487
Interest Rate
6.92%
Mortgage Type
Purchase Money Mortgage
Estimated Equity
$343,216
Purchase Details
Closed on
Dec 30, 1988
Sold by
Mccluer C H
Bought by
Griffin Wayne H
Create a Home Valuation Report for This Property
The Home Valuation Report is an in-depth analysis detailing your home's value as well as a comparison with similar homes in the area
Home Values in the Area
Average Home Value in this Area
Purchase History
| Date | Buyer | Sale Price | Title Company |
|---|---|---|---|
| Wians Scott | $219,000 | -- | |
| Griffin Wayne H | $125,000 | -- |
Source: Public Records
Mortgage History
| Date | Status | Borrower | Loan Amount |
|---|---|---|---|
| Open | Griffin Wayne H | $208,000 | |
| Previous Owner | Griffin Wayne H | $120,000 | |
| Previous Owner | Griffin Wayne H | $25,000 | |
| Previous Owner | Griffin Wayne H | $100,500 |
Source: Public Records
Tax History Compared to Growth
Tax History
| Year | Tax Paid | Tax Assessment Tax Assessment Total Assessment is a certain percentage of the fair market value that is determined by local assessors to be the total taxable value of land and additions on the property. | Land | Improvement |
|---|---|---|---|---|
| 2025 | $5,051 | $334,500 | $125,400 | $209,100 |
| 2024 | $5,293 | $324,100 | $125,400 | $198,700 |
| 2023 | $5,140 | $317,700 | $125,400 | $192,300 |
| 2022 | $4,842 | $270,500 | $126,300 | $144,200 |
| 2021 | $0 | $242,500 | $114,800 | $127,700 |
| 2020 | $6,274 | $248,500 | $114,800 | $133,700 |
| 2019 | $43 | $241,800 | $105,600 | $136,200 |
| 2018 | $6,015 | $224,900 | $100,500 | $124,400 |
| 2017 | $4,058 | $210,700 | $100,500 | $110,200 |
| 2016 | $4,139 | $214,000 | $91,200 | $122,800 |
| 2015 | $4,112 | $211,100 | $91,200 | $119,900 |
Source: Public Records
Map
Nearby Homes
- 60 Freeman St
- 70 Oswego St
- 90 Pleasant St
- 20 Cooks Ln
- 41 Mansion St
- 15 Fox Run Rd Unit 15
- 49R Elm St
- 25 Lakeview St
- 43 Edgewater Dr
- 540 Pulaski Blvd
- Lot 2 Pulaski Blvd
- 361 S Main St
- 40 Valley St
- 21 Irving St
- 13 Ethel St
- Lot 1 Pickering Rd
- Lot 5 Pickering Rd
- Lot 2 Pickering Rd
- Lot 4 Pickering Rd
- Lot 3 Pickering Rd