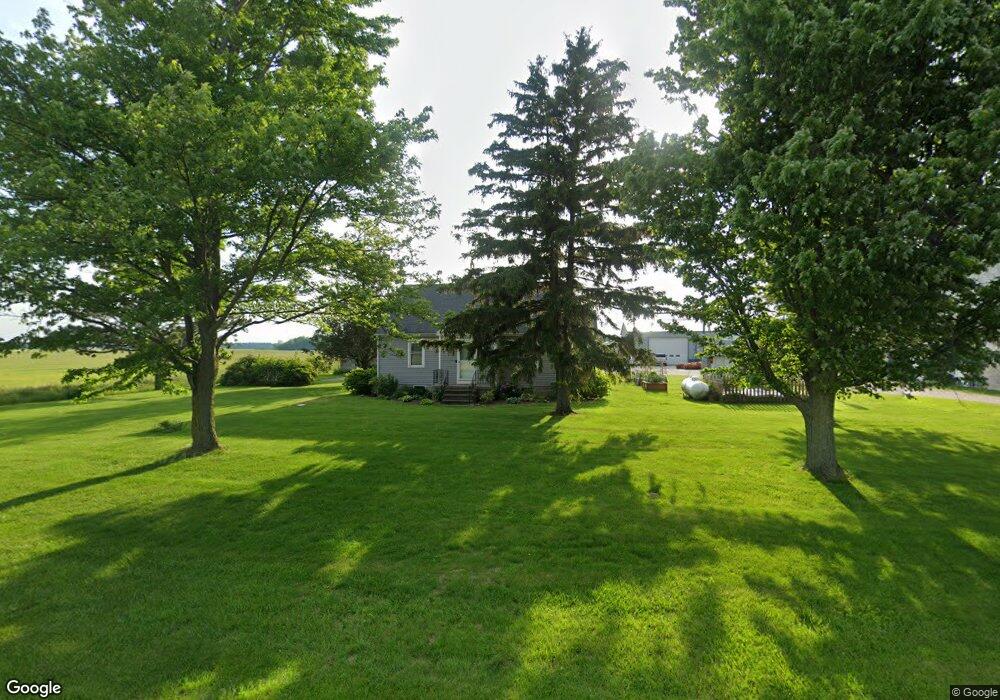
732 S Graytown Rd Elmore, OH 43416
Estimated Value: $133,000 - $189,000
3
Beds
1
Bath
1,699
Sq Ft
$95/Sq Ft
Est. Value
About This Home
This home is located at 732 S Graytown Rd, Elmore, OH 43416 and is currently estimated at $162,168, approximately $95 per square foot. 732 S Graytown Rd is a home located in Ottawa County with nearby schools including Woodmore Elementary School and Woodmore Middle School.
Ownership History
Date
Name
Owned For
Owner Type
Purchase Details
Closed on
Feb 9, 2007
Sold by
Boss Barry
Bought by
Boss Mark E
Current Estimated Value
Home Financials for this Owner
Home Financials are based on the most recent Mortgage that was taken out on this home.
Original Mortgage
$38,500
Outstanding Balance
$23,137
Interest Rate
6.22%
Mortgage Type
Purchase Money Mortgage
Estimated Equity
$139,031
Purchase Details
Closed on
Mar 14, 2003
Sold by
Donnelly Et Al Larry E
Bought by
Boss Barry
Home Financials for this Owner
Home Financials are based on the most recent Mortgage that was taken out on this home.
Original Mortgage
$30,000
Interest Rate
6%
Mortgage Type
Seller Take Back
Purchase Details
Closed on
Mar 13, 2003
Sold by
Donnelly Larry E and Donnelly Shirley A
Bought by
Boss Barry
Home Financials for this Owner
Home Financials are based on the most recent Mortgage that was taken out on this home.
Original Mortgage
$30,000
Interest Rate
6%
Mortgage Type
Seller Take Back
Create a Home Valuation Report for This Property
The Home Valuation Report is an in-depth analysis detailing your home's value as well as a comparison with similar homes in the area
Home Values in the Area
Average Home Value in this Area
Purchase History
| Date | Buyer | Sale Price | Title Company |
|---|---|---|---|
| Boss Mark E | $35,000 | Attorney | |
| Boss Barry | $30,000 | -- | |
| Boss Barry | $30,000 | -- |
Source: Public Records
Mortgage History
| Date | Status | Borrower | Loan Amount |
|---|---|---|---|
| Open | Boss Mark E | $38,500 | |
| Previous Owner | Boss Barry | $30,000 |
Source: Public Records
Tax History Compared to Growth
Tax History
| Year | Tax Paid | Tax Assessment Tax Assessment Total Assessment is a certain percentage of the fair market value that is determined by local assessors to be the total taxable value of land and additions on the property. | Land | Improvement |
|---|---|---|---|---|
| 2024 | $2,038 | $44,188 | $9,097 | $35,091 |
| 2023 | $2,038 | $35,116 | $6,930 | $28,186 |
| 2022 | $1,749 | $35,116 | $6,930 | $28,186 |
| 2021 | $1,761 | $35,120 | $6,930 | $28,190 |
| 2020 | $1,608 | $30,900 | $5,730 | $25,170 |
| 2019 | $1,585 | $30,900 | $5,730 | $25,170 |
| 2018 | $1,564 | $30,900 | $5,730 | $25,170 |
| 2017 | $1,470 | $29,080 | $5,730 | $23,350 |
| 2016 | $1,430 | $29,080 | $5,730 | $23,350 |
| 2015 | $1,547 | $29,080 | $5,730 | $23,350 |
| 2014 | $797 | $29,080 | $5,730 | $23,350 |
| 2013 | $1,593 | $29,080 | $5,730 | $23,350 |
Source: Public Records
Map
Nearby Homes
- 0 W Portage River Rd S Unit 6130453
- 14878 W State Route 163
- 19383 Courtland Ave
- 14339 3rd St
- 0 N Graytown Rd
- 16030 W Moline-Martin Rd
- 1861 N Opfer-Lentz Rd
- 20240 W Portage River South Rd
- 207 E 11th St
- 904 Main St
- 1350 N Genoa Clay Center Rd
- 514 West St
- 1301 West St
- 510 Wilson St
- 506 W Water St
- 3262 Toussaint-Portage Rd
- 1615 N Thyre Dr
- 416 Castle Cove
- 11123 W Portage River South Rd
- 214 N Church St
- 940 S Graytown Rd
- 970 S Graytown Rd
- 1028 S Graytown Rd
- 455 S Graytown Rd
- 900 S Graytown Rd
- 17336 W Kempke Rd
- 1214 S Graytown Rd
- 227 S Graytown Rd
- 85 S Graytown Rd
- 17629 W Kempke Rd
- 17629 W Kempke Rd
- 16958 W State Route 163
- 2 N Graytown Rd
- 3 N Graytown Rd
- 17017 W State Route 105
- 17055 W State Route 105
- 17025 W Graytown
- 182558 State Route 163
- 17110 W State Route 105
- 17151 W State Route 105