Estimated Value: $220,000 - $232,000
3
Beds
2
Baths
1,331
Sq Ft
$168/Sq Ft
Est. Value
About This Home
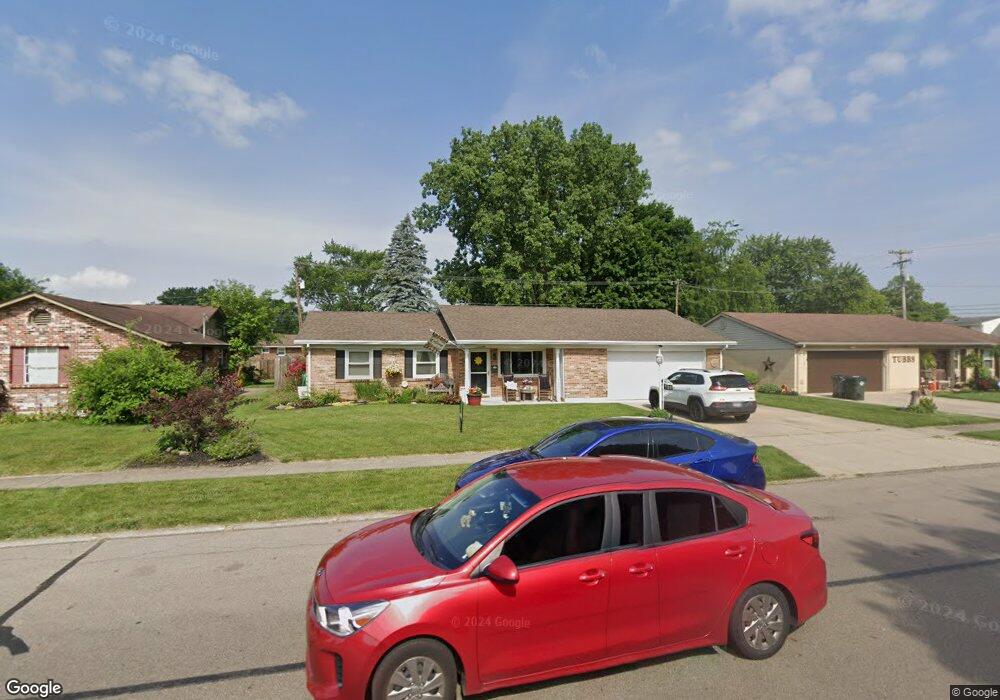
This home is located at 732 Stonyridge Ave, Troy, OH 45373 and is currently estimated at $223,885, approximately $168 per square foot. 732 Stonyridge Ave is a home located in Miami County with nearby schools including Cookson Elementary School, Troy Junior High School, and Van Cleve Elementary School.
Ownership History
Date
Name
Owned For
Owner Type
Purchase Details
Closed on
Jan 20, 2009
Sold by
Dankworth Betty A
Bought by
Dankworth Michael A
Current Estimated Value
Purchase Details
Closed on
Jan 3, 2008
Sold by
Kappers Alicia S and Kappers Andrew P
Bought by
Dankworth Michael A and Dankworth Betty A
Home Financials for this Owner
Home Financials are based on the most recent Mortgage that was taken out on this home.
Original Mortgage
$116,674
Interest Rate
6.27%
Mortgage Type
FHA
Purchase Details
Closed on
Jan 7, 2005
Sold by
Kappers Alan M and Kappers Deborah A
Bought by
Kappers Alicia S and Kappers Andrew P
Purchase Details
Closed on
Dec 30, 2004
Sold by
Kappers Alan M and Kappers Deborah A
Bought by
Kappers Alicia S and Kappers Andrew P
Purchase Details
Closed on
Jan 1, 1990
Bought by
Kappers Alan M
Create a Home Valuation Report for This Property
The Home Valuation Report is an in-depth analysis detailing your home's value as well as a comparison with similar homes in the area
Home Values in the Area
Average Home Value in this Area
Purchase History
| Date | Buyer | Sale Price | Title Company |
|---|---|---|---|
| Dankworth Michael A | -- | -- | |
| Dankworth Michael A | $106,000 | -- | |
| Kappers Alicia S | -- | -- | |
| Kappers Alicia S | -- | -- | |
| Kappers Alan M | -- | -- |
Source: Public Records
Mortgage History
| Date | Status | Borrower | Loan Amount |
|---|---|---|---|
| Previous Owner | Kappers Alicia S | $116,674 |
Source: Public Records
Tax History Compared to Growth
Tax History
| Year | Tax Paid | Tax Assessment Tax Assessment Total Assessment is a certain percentage of the fair market value that is determined by local assessors to be the total taxable value of land and additions on the property. | Land | Improvement |
|---|---|---|---|---|
| 2024 | $2,037 | $54,050 | $12,080 | $41,970 |
| 2023 | $2,037 | $54,050 | $12,080 | $41,970 |
| 2022 | $1,697 | $54,050 | $12,080 | $41,970 |
| 2021 | $1,373 | $41,550 | $9,280 | $32,270 |
| 2020 | $1,375 | $41,550 | $9,280 | $32,270 |
| 2019 | $1,388 | $41,550 | $9,280 | $32,270 |
| 2018 | $1,260 | $36,300 | $9,840 | $26,460 |
| 2017 | $1,272 | $36,300 | $9,840 | $26,460 |
| 2016 | $1,253 | $36,300 | $9,840 | $26,460 |
| 2015 | $1,234 | $34,240 | $9,280 | $24,960 |
| 2014 | $1,234 | $34,240 | $9,280 | $24,960 |
| 2013 | $1,242 | $34,240 | $9,280 | $24,960 |
Source: Public Records
Map
Nearby Homes
- 1002 Stonyridge Ave
- 1310 Saratoga Dr
- 1329 Lee Rd
- 429 Forrest Ln
- 1075 Crestview Dr
- 1947 Woodcliffe Dr
- 1760 Hunters Ridge Dr
- 605 Ohio Ave
- 1500 Paradise Trail
- 731 Michigan Ave
- 1400 Troy Urbana Rd
- 708 N Market St
- 190 Robin Hood Ln
- 1160 Waterloo St
- 1188 E Bentley Cir
- 1164 Waterloo St
- 1137 Auburn St
- 755 W Bentley Cir
- 221 Finsbury Ln
- 838 W Bentley Cir
- 696 Stonyridge Ave
- 786 Stonyridge Ave
- 1107 Mystic Ln N
- 1099 Mystic Ln N
- 692 Stonyridge Ave
- 799 Stonyridge Ave
- 1115 Mystic Ln N
- 790 Stonyridge Ave
- 1250 Longwood Dr
- 627 Stonyridge Ave
- 688 Stonyridge Ave
- 1091 Mystic Ln N
- 1220 Longwood Dr
- 803 Stonyridge Ave
- 1091 N Mystic Ln
- 1114 Mystic Ln S
- 623 Stonyridge Ave
- 641 Carriage Dr
- 1206 Longwood Dr
- 634 Carriage Dr