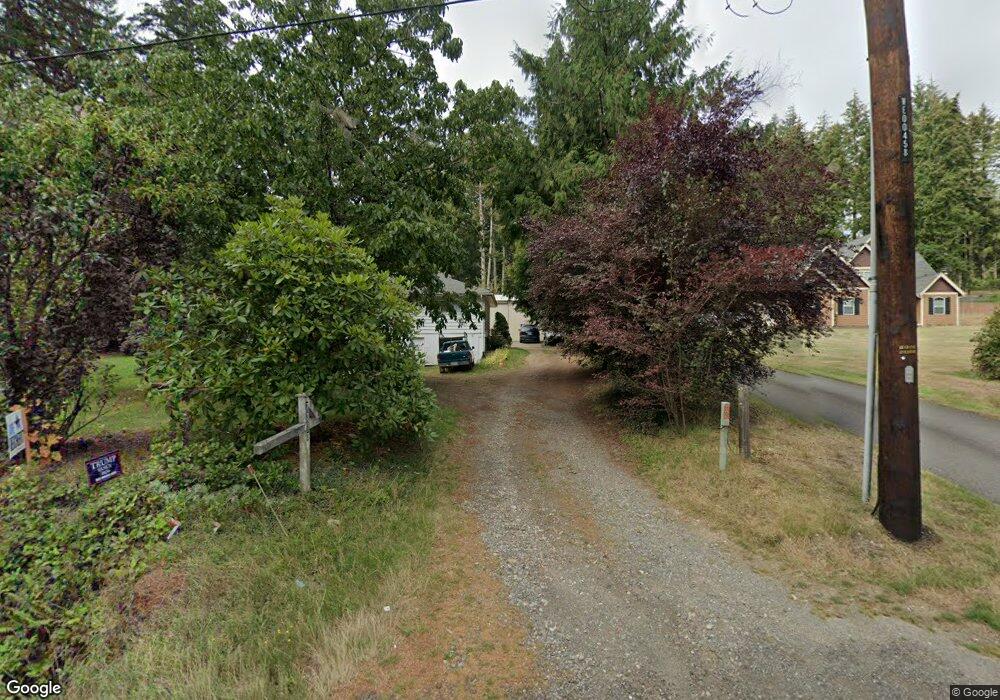
7320 Sidney Rd SW Port Orchard, WA 98367
Estimated Value: $518,000 - $740,000
4
Beds
2
Baths
1,550
Sq Ft
$399/Sq Ft
Est. Value
About This Home
This home is located at 7320 Sidney Rd SW, Port Orchard, WA 98367 and is currently estimated at $618,493, approximately $399 per square foot. 7320 Sidney Rd SW is a home located in Kitsap County with nearby schools including Sidney Glen Elementary School, Cedar Heights Middle School, and South Kitsap High School.
Ownership History
Date
Name
Owned For
Owner Type
Purchase Details
Closed on
Nov 20, 2008
Sold by
White Jesse Duane
Bought by
Bender Frederick J and Bender Cynthia
Current Estimated Value
Create a Home Valuation Report for This Property
The Home Valuation Report is an in-depth analysis detailing your home's value as well as a comparison with similar homes in the area
Home Values in the Area
Average Home Value in this Area
Purchase History
| Date | Buyer | Sale Price | Title Company |
|---|---|---|---|
| Bender Frederick J | -- | None Available |
Source: Public Records
Tax History Compared to Growth
Tax History
| Year | Tax Paid | Tax Assessment Tax Assessment Total Assessment is a certain percentage of the fair market value that is determined by local assessors to be the total taxable value of land and additions on the property. | Land | Improvement |
|---|---|---|---|---|
| 2026 | $574 | $376,540 | $86,790 | $289,750 |
| 2025 | $574 | $376,540 | $86,790 | $289,750 |
| 2024 | $562 | $376,540 | $86,790 | $289,750 |
| 2023 | $535 | $376,540 | $86,790 | $289,750 |
| 2022 | $601 | $302,480 | $69,180 | $233,300 |
| 2021 | $625 | $272,780 | $62,890 | $209,890 |
| 2020 | $639 | $290,890 | $61,700 | $229,190 |
| 2019 | $664 | $270,130 | $57,020 | $213,110 |
| 2018 | $701 | $218,910 | $49,080 | $169,830 |
| 2017 | $677 | $218,910 | $49,080 | $169,830 |
| 2016 | $658 | $195,540 | $46,740 | $148,800 |
| 2015 | $1,034 | $191,830 | $46,740 | $145,090 |
| 2014 | -- | $175,600 | $48,880 | $126,720 |
| 2013 | -- | $175,600 | $48,880 | $126,720 |
Source: Public Records
Map
Nearby Homes
- 700 SW Black Jack Ln
- 7261 Fern Vista Place SW
- 0 SW Glenwood Rd Unit NWM2457669
- 30 Acres Glenwood Rd SW
- 8718 Sidney Rd SW
- Sherwood Plan at Stetson Heights
- Cambridge Plan at Stetson Heights
- Bristol Plan at Stetson Heights
- Berkshire Plan at Stetson Heights
- Hawthorne Plan at Stetson Heights
- Ballard Plan at Stetson Heights
- Bradford Plan at Stetson Heights
- 15081 Glenwood Rd SW
- 1123 SW Sedge St
- 1131 SW Sedge St
- 5965 Waverly Rd SW
- 7487 Bethel Burley Rd SE
- 8840 Conwhit Ln SW
- 7988 Bethel Burley Rd SE
- 959 SE Spencer Ave
- 455 SW Taft Blvd
- 7328 Sidney Rd SW
- 7284 Sidney Rd SW
- 571 SW Taft Blvd
- 471 SW Taft Blvd
- 7183 Sidney Rd SW
- 546 SW Miller Rd
- 482 SW Taft Blvd
- 7353 Sidney Rd SW
- 7275 Roosevelt Ave SW
- 635 SW Miller Rd
- 7141 Sidney Rd SW
- 7345 Roosevelt Ave SW
- 7500 Sidney Rd SW
- 530 SW Taft Blvd
- 7170 Sidney Rd SW
- 7111 Sidney Rd SW
- 469 SW Cleveland St
- 706 Roosevelt Ave SW
- 7405 Sidney Rd SW