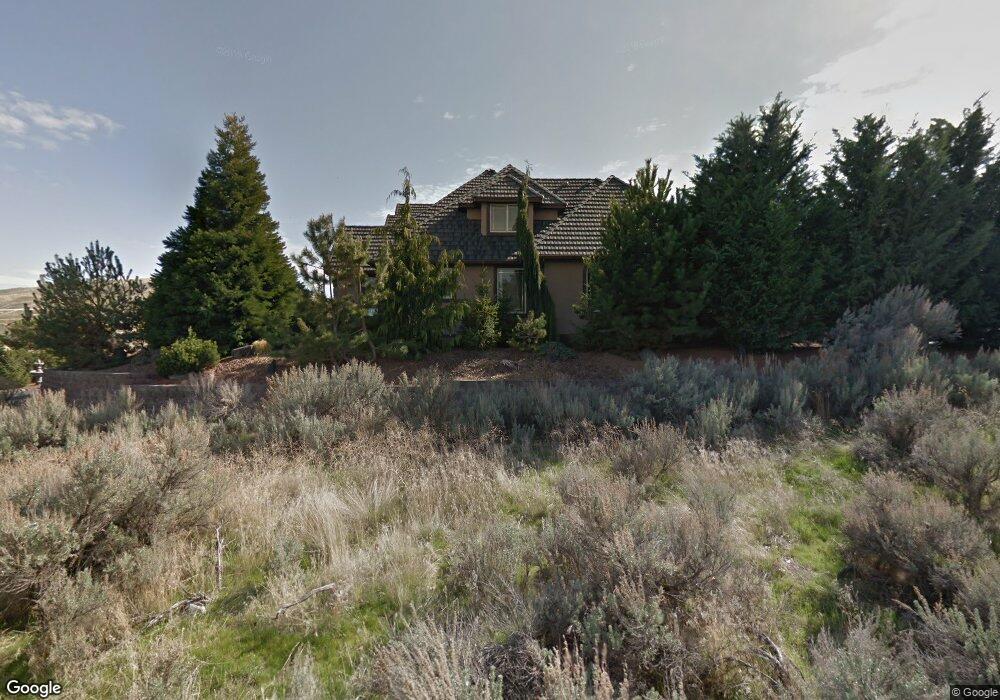
73206 E 279 Prairie NE Unit Stunning, One of a K Richland, WA 99352
Estimated Value: $924,224 - $1,251,000
4
Beds
4
Baths
3,438
Sq Ft
$300/Sq Ft
Est. Value
About This Home
This home is located at 73206 E 279 Prairie NE Unit Stunning, One of a K, Richland, WA 99352 and is currently estimated at $1,029,806, approximately $299 per square foot. 73206 E 279 Prairie NE Unit Stunning, One of a K is a home located in Benton County with nearby schools including White Bluffs Elementary School, Enterprise Middle School, and Richland High School.
Ownership History
Date
Name
Owned For
Owner Type
Purchase Details
Closed on
Jul 10, 2024
Sold by
Suarez Kelly Anne and Suarez Osvaldo Edward
Bought by
Suarez Osvaldo Edward
Current Estimated Value
Home Financials for this Owner
Home Financials are based on the most recent Mortgage that was taken out on this home.
Original Mortgage
$200,000
Outstanding Balance
$190,335
Interest Rate
6.36%
Mortgage Type
New Conventional
Estimated Equity
$839,471
Purchase Details
Closed on
Sep 14, 2018
Sold by
Roberts Clint and Roberts Ann
Bought by
Suarez Osvaldo E
Home Financials for this Owner
Home Financials are based on the most recent Mortgage that was taken out on this home.
Original Mortgage
$419,930
Interest Rate
4.5%
Mortgage Type
New Conventional
Purchase Details
Closed on
Jun 22, 2006
Sold by
Roberts Clint and Roberts Ann
Bought by
Roberts Clint and Roberts Ann
Create a Home Valuation Report for This Property
The Home Valuation Report is an in-depth analysis detailing your home's value as well as a comparison with similar homes in the area
Home Values in the Area
Average Home Value in this Area
Purchase History
| Date | Buyer | Sale Price | Title Company |
|---|---|---|---|
| Suarez Osvaldo Edward | $313 | Benton Franklin Title | |
| Suarez Osvaldo E | $599,900 | Columbia Title Co | |
| Roberts Clint | -- | None Available |
Source: Public Records
Mortgage History
| Date | Status | Borrower | Loan Amount |
|---|---|---|---|
| Open | Suarez Osvaldo Edward | $200,000 | |
| Previous Owner | Suarez Osvaldo E | $419,930 |
Source: Public Records
Tax History Compared to Growth
Tax History
| Year | Tax Paid | Tax Assessment Tax Assessment Total Assessment is a certain percentage of the fair market value that is determined by local assessors to be the total taxable value of land and additions on the property. | Land | Improvement |
|---|---|---|---|---|
| 2024 | $8,240 | $923,820 | $97,000 | $826,820 |
| 2023 | $8,240 | $782,080 | $97,000 | $685,080 |
| 2022 | $7,863 | $644,250 | $97,000 | $547,250 |
| 2021 | $7,345 | $644,250 | $97,000 | $547,250 |
| 2020 | $7,640 | $578,580 | $97,000 | $481,580 |
| 2019 | $5,345 | $578,580 | $97,000 | $481,580 |
| 2018 | $6,133 | $428,570 | $42,000 | $386,570 |
| 2017 | $5,456 | $428,570 | $42,000 | $386,570 |
| 2016 | $5,393 | $428,570 | $42,000 | $386,570 |
| 2015 | $5,502 | $428,570 | $42,000 | $386,570 |
| 2014 | -- | $428,570 | $42,000 | $386,570 |
| 2013 | -- | $428,570 | $42,000 | $386,570 |
Source: Public Records
Map
Nearby Homes
- 28605 Dallas Rd
- 4949 Rau Ln
- 28509 Dallas Rd
- 900 Cayuse Dr
- 1020 Chinook Dr
- 20906 Bretz Prairie NE
- 3700 Arena Rd
- 1058 Klikitat St
- 70022 E 669 Prairie NE
- 1063 Klamath Ct
- 4529 Grove Ct
- 4545 Grove Ct
- 1023 Makah Ct Unit Lot 2
- 4537 Grove Ct
- 1007 Makah Ct Unit Lot 1
- 1055 Makah Ct Unit Lot 4
- 1056 Makah Ct
- 1072 Makah Ct
- 1004 Sirron Ave
- 4361 Cowlitz Blvd
- 73206 E 279 Prne
- 73206 E 279 Prairie NE
- 73206 E 279 Prairie NE Unit Priced below what th
- 27414 Dallas Rd
- 73207 E 279 Prairie NE
- 72812 E 279 Prairie NE
- 72404 E 266 Prairie NE
- 71129 Arena Rd
- 4975 Rau St
- 28005 Dallas Rd
- 28005 Dallas Rd
- 72602 E 266 Prairie NE
- 72323 E 266 Prairie NE
- 72323 E 266 Prairie NE Unit For Comp only/ FSBO
- 4960 Rau St
- 28708 Dallas Rd
- 26701 Dallas Rd
- 4997 Cowlitz Blvd
- 26711 Dallas Rd
- 4949 Rau St