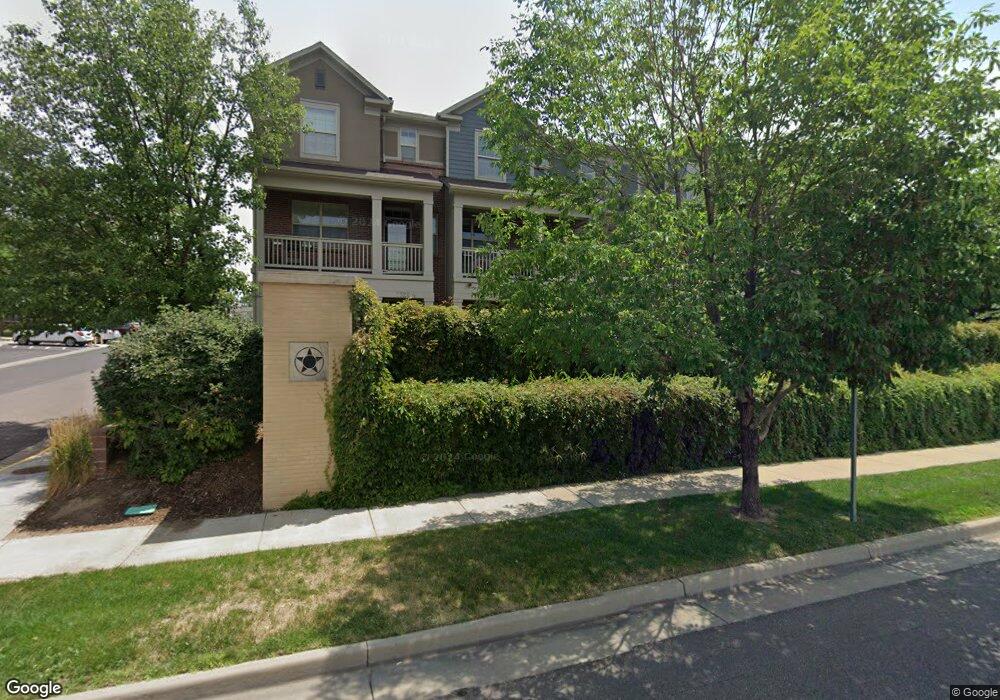
7322 E 7th Ave Unit 1 Denver, CO 80230
Lowry NeighborhoodEstimated Value: $485,000 - $561,000
3
Beds
3
Baths
1,461
Sq Ft
$350/Sq Ft
Est. Value
About This Home
This home is located at 7322 E 7th Ave Unit 1, Denver, CO 80230 and is currently estimated at $511,045, approximately $349 per square foot. 7322 E 7th Ave Unit 1 is a home located in Denver County with nearby schools including Lowry Elementary School, Hill Campus of Arts & Sciences, and George Washington High School.
Ownership History
Date
Name
Owned For
Owner Type
Purchase Details
Closed on
Jul 28, 2022
Sold by
Kevin Ellis
Bought by
Chomiak Katie R
Current Estimated Value
Purchase Details
Closed on
Jun 18, 2013
Sold by
Hawkins Brian A and Hawkins Angela C
Bought by
Ellis Kevin
Home Financials for this Owner
Home Financials are based on the most recent Mortgage that was taken out on this home.
Original Mortgage
$242,730
Interest Rate
3.63%
Mortgage Type
New Conventional
Purchase Details
Closed on
Dec 3, 2007
Sold by
Mcstain Enterprises Inc
Bought by
Hawkins Brian A and Hawkins Angela C
Home Financials for this Owner
Home Financials are based on the most recent Mortgage that was taken out on this home.
Original Mortgage
$197,088
Interest Rate
6.4%
Mortgage Type
Purchase Money Mortgage
Create a Home Valuation Report for This Property
The Home Valuation Report is an in-depth analysis detailing your home's value as well as a comparison with similar homes in the area
Home Values in the Area
Average Home Value in this Area
Purchase History
| Date | Buyer | Sale Price | Title Company |
|---|---|---|---|
| Chomiak Katie R | $525,100 | First American Title | |
| Ellis Kevin | $530,000 | None Listed On Document | |
| Ellis Kevin | $269,700 | Land Title Guarantee Company | |
| Hawkins Brian A | $262,784 | Land Title Guarantee Company |
Source: Public Records
Mortgage History
| Date | Status | Borrower | Loan Amount |
|---|---|---|---|
| Previous Owner | Ellis Kevin | $242,730 | |
| Previous Owner | Hawkins Brian A | $197,088 |
Source: Public Records
Tax History
| Year | Tax Paid | Tax Assessment Tax Assessment Total Assessment is a certain percentage of the fair market value that is determined by local assessors to be the total taxable value of land and additions on the property. | Land | Improvement |
|---|---|---|---|---|
| 2025 | $2,363 | $35,990 | $2,350 | $2,350 |
| 2024 | $2,363 | $29,840 | $2,230 | $27,610 |
| 2023 | $2,312 | $29,840 | $2,230 | $27,610 |
| 2022 | $2,170 | $27,290 | $1,800 | $25,490 |
| 2021 | $2,095 | $28,070 | $1,850 | $26,220 |
| 2020 | $2,105 | $28,370 | $1,850 | $26,520 |
| 2019 | $2,046 | $28,370 | $1,850 | $26,520 |
| 2018 | $1,907 | $24,650 | $1,600 | $23,050 |
| 2017 | $1,901 | $24,650 | $1,600 | $23,050 |
| 2016 | $1,914 | $23,470 | $1,767 | $21,703 |
| 2015 | $1,834 | $23,470 | $1,767 | $21,703 |
| 2014 | $1,712 | $20,610 | $828 | $19,782 |
Source: Public Records
Map
Nearby Homes
- 732 Poplar St
- 7450 E 6th Ave
- 7134 E 6th Avenue Pkwy
- 7030 E 7th Ave
- 7680 E 6th Ave
- 812 Poplar St
- 7722 E 6th Place
- 822 Pontiac St
- 431 Poplar St
- 7444 E 9th Ave
- 7752 E 4th Ave Unit 2C
- 7337 E 10th Ave
- 982 Roslyn St
- 1003 Roslyn Ct
- 7752 E 8th Place
- 7525 E 1st Place Unit A1012
- 300 Oneida St
- 7777 E 1st Place Unit 108
- 253 Oneida Ct
- 1100 Pontiac St
- 7322 E 7th Ave
- 7322 E 7th Ave
- 7322 E 7th Ave
- 7322 E 7th Ave
- 7322 E 7th Ave Unit 2
- 7322 E 7th Ave Unit 3
- 7322 E 7 Ave Unit 1
- 7352 E 7th Ave
- 7352 E 7th Ave
- 7352 E 7th Ave
- 7352 E 7th Ave
- 7352 E 7th Ave Unit 7
- 7352 E 7th Ave Unit 6
- 7352 E 7th Ave Unit 8
- 7352 E 7th Ave Unit 5
- 7321 E 6th Ave
- 7382 E 7th Ave
- 7382 E 7th Ave
- 7382 E 7th Ave
- 7382 E 7th Ave Unit 11
Your Personal Tour Guide
Ask me questions while you tour the home.