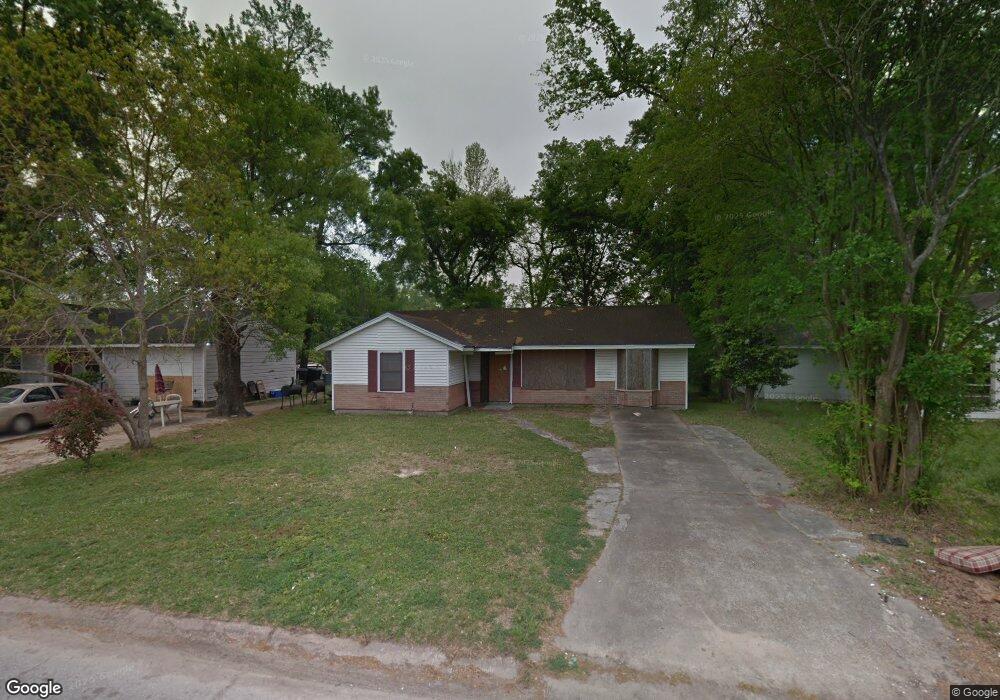
7322 Sterlingshire St Houston, TX 77016
East Little York NeighborhoodEstimated Value: $164,273 - $189,000
4
Beds
2
Baths
1,230
Sq Ft
$143/Sq Ft
Est. Value
About This Home
This home is located at 7322 Sterlingshire St, Houston, TX 77016 and is currently estimated at $176,068, approximately $143 per square foot. 7322 Sterlingshire St is a home located in Harris County with nearby schools including Shadydale Elementary School, Forest Brook Middle, and North Forest High School.
Ownership History
Date
Name
Owned For
Owner Type
Purchase Details
Closed on
Oct 1, 2021
Sold by
Reeves Claire and Reeves Lee
Bought by
Cook Jeremiah D
Current Estimated Value
Purchase Details
Closed on
Sep 4, 2015
Sold by
Reeves Claire
Bought by
Reeves Lee
Home Financials for this Owner
Home Financials are based on the most recent Mortgage that was taken out on this home.
Original Mortgage
$56,250
Interest Rate
4.03%
Mortgage Type
New Conventional
Purchase Details
Closed on
Feb 20, 2015
Sold by
Fleming Gary
Bought by
Reeves Claire
Home Financials for this Owner
Home Financials are based on the most recent Mortgage that was taken out on this home.
Original Mortgage
$60,000
Interest Rate
3.78%
Mortgage Type
Purchase Money Mortgage
Purchase Details
Closed on
Dec 3, 2014
Sold by
Peck Johnnie
Bought by
Fleming Gary
Purchase Details
Closed on
Nov 19, 2013
Sold by
Perlo Development Ii Inc
Bought by
Peck Johnie
Home Financials for this Owner
Home Financials are based on the most recent Mortgage that was taken out on this home.
Original Mortgage
$52,500
Interest Rate
4.34%
Mortgage Type
Purchase Money Mortgage
Create a Home Valuation Report for This Property
The Home Valuation Report is an in-depth analysis detailing your home's value as well as a comparison with similar homes in the area
Home Values in the Area
Average Home Value in this Area
Purchase History
| Date | Buyer | Sale Price | Title Company |
|---|---|---|---|
| Cook Jeremiah D | -- | Fidelity National Title | |
| Reeves Lee | -- | Chicago Title | |
| Reeves Claire | -- | Chicago Title | |
| Fleming Gary | $47,927 | None Available | |
| Peck Johnie | -- | American Title Co |
Source: Public Records
Mortgage History
| Date | Status | Borrower | Loan Amount |
|---|---|---|---|
| Previous Owner | Reeves Lee | $56,250 | |
| Previous Owner | Reeves Claire | $60,000 | |
| Previous Owner | Peck Johnie | $52,500 |
Source: Public Records
Tax History Compared to Growth
Tax History
| Year | Tax Paid | Tax Assessment Tax Assessment Total Assessment is a certain percentage of the fair market value that is determined by local assessors to be the total taxable value of land and additions on the property. | Land | Improvement |
|---|---|---|---|---|
| 2025 | $3,516 | $189,545 | $52,200 | $137,345 |
| 2024 | $3,516 | $168,043 | $52,200 | $115,843 |
| 2023 | $3,516 | $178,324 | $43,200 | $135,124 |
| 2022 | $2,847 | $129,309 | $36,000 | $93,309 |
| 2021 | $2,900 | $124,408 | $27,000 | $97,408 |
| 2020 | $2,252 | $93,000 | $18,720 | $74,280 |
| 2019 | $2,274 | $89,854 | $12,312 | $77,542 |
| 2018 | $1,177 | $46,500 | $12,312 | $34,188 |
| 2017 | $1,176 | $46,500 | $12,312 | $34,188 |
| 2016 | $1,176 | $46,500 | $12,312 | $34,188 |
| 2015 | $772 | $37,216 | $12,312 | $24,904 |
| 2014 | $772 | $30,029 | $12,312 | $17,717 |
Source: Public Records
Map
Nearby Homes
- 7338 Bigwood St
- 0 Wileyvale Rd Unit 37533417
- 0 Laura Koppe Rd Unit 64066450
- 0 Lockwood Unit 97801497
- 0 Wileyvale Rd Unit 98938709
- 7314 Sterlingshire St
- 0 Bretshire Dr Unit 83088734
- 0 Bretshire Dr Unit 61965426
- 7242 Bretshire Dr
- 7402 Yoe St
- 7305 Yoe St
- 7218 Bretshire Dr
- 7611 Cabot St
- 7252 Parker Rd
- 7306 Parker Rd
- 7603 Caddo Rd
- 10106 Cheeves Dr
- 10101 Rebel Rd
- 7220 Parker Rd
- 7639 Bigwood St
- 7326 Sterlingshire St
- 7318 Sterlingshire St
- 7330 Sterlingshire St
- 7421 Cabot St
- 7417 Cabot St
- 7425 Cabot St
- 7429 Cabot St
- 7413 Cabot St
- 7334 Sterlingshire St
- 7321 Sterlingshire St
- 7310 Sterlingshire St
- 7325 Sterlingshire St
- 7317 Sterlingshire St
- 7329 Sterlingshire St
- 7409 Cabot St
- 7433 Cabot St
- 7313 Sterlingshire St
- 7402 Sterlingshire St
- 7306 Sterlingshire St
- 7333 Sterlingshire St