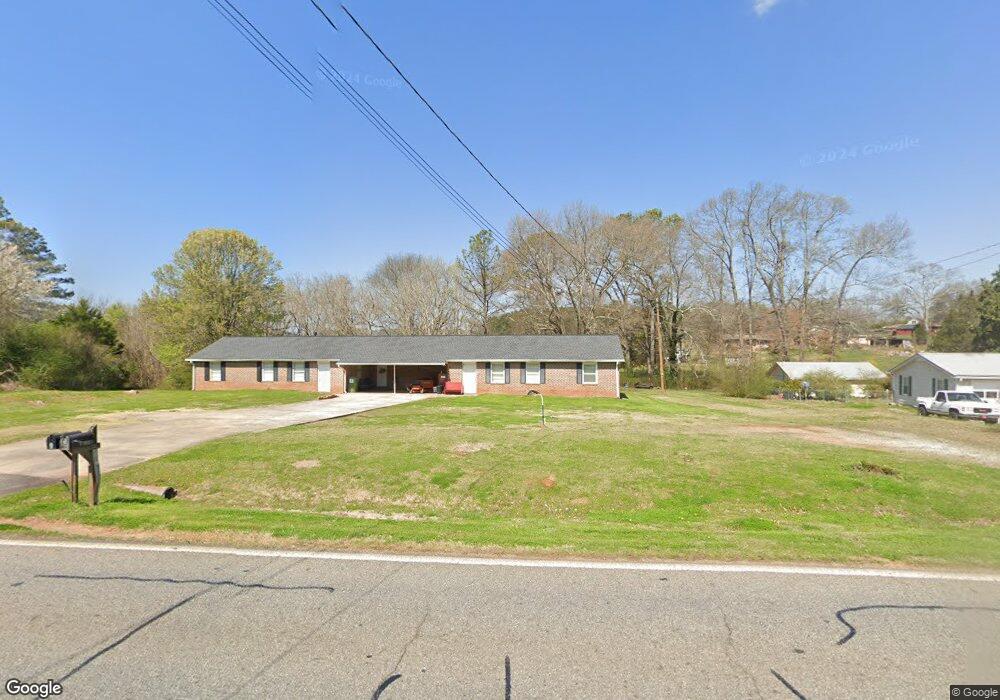
7324 Cave Spring Rd SW Cave Spring, GA 30124
Estimated Value: $193,000 - $313,226
--
Bed
1
Bath
2,288
Sq Ft
$119/Sq Ft
Est. Value
About This Home
This home is located at 7324 Cave Spring Rd SW, Cave Spring, GA 30124 and is currently estimated at $273,057, approximately $119 per square foot. 7324 Cave Spring Rd SW is a home located in Floyd County with nearby schools including Coosa Middle School and Coosa High School.
Ownership History
Date
Name
Owned For
Owner Type
Purchase Details
Closed on
Mar 5, 2025
Sold by
Mclean Mitchell
Bought by
Cashflowbros Llc
Current Estimated Value
Purchase Details
Closed on
Sep 27, 2022
Sold by
Hicks Cassidy
Bought by
Hicks Cordle Hali and Hicks Christopher Christopher
Purchase Details
Closed on
Oct 22, 2021
Sold by
Williams Carol
Bought by
Cordle Hali Hicks and Hicks Cassidy
Purchase Details
Closed on
Mar 7, 2008
Sold by
Perkins Edward E
Bought by
Williams V Carol
Purchase Details
Closed on
May 7, 1979
Sold by
Wood Fred W
Bought by
Perkins Edward E
Purchase Details
Closed on
Dec 9, 1977
Sold by
Wilson Armister B
Bought by
Wood Fred W
Purchase Details
Closed on
Nov 19, 1964
Sold by
Warren Charles R
Bought by
Wilson Armister B
Purchase Details
Closed on
Jan 1, 1961
Bought by
Warren Charles R
Create a Home Valuation Report for This Property
The Home Valuation Report is an in-depth analysis detailing your home's value as well as a comparison with similar homes in the area
Home Values in the Area
Average Home Value in this Area
Purchase History
| Date | Buyer | Sale Price | Title Company |
|---|---|---|---|
| Cashflowbros Llc | -- | -- | |
| Hicks Cordle Hali | -- | -- | |
| Cordle Hali Hicks | $100,000 | -- | |
| Williams V Carol | $89,000 | -- | |
| Perkins Edward E | $15,000 | -- | |
| Wood Fred W | $10,500 | -- | |
| Wilson Armister B | -- | -- | |
| Warren Charles R | -- | -- |
Source: Public Records
Tax History Compared to Growth
Tax History
| Year | Tax Paid | Tax Assessment Tax Assessment Total Assessment is a certain percentage of the fair market value that is determined by local assessors to be the total taxable value of land and additions on the property. | Land | Improvement |
|---|---|---|---|---|
| 2024 | $3,429 | $120,586 | $14,612 | $105,974 |
| 2023 | $3,061 | $116,106 | $13,284 | $102,822 |
| 2022 | $1,095 | $95,172 | $10,854 | $84,318 |
| 2021 | $1,153 | $41,360 | $9,891 | $31,469 |
| 2020 | $1,081 | $38,423 | $8,601 | $29,822 |
| 2019 | $1,018 | $36,706 | $8,601 | $28,105 |
| 2018 | $913 | $32,855 | $8,192 | $24,663 |
| 2017 | $874 | $31,404 | $7,585 | $23,819 |
| 2016 | $812 | $28,817 | $7,560 | $21,257 |
| 2015 | $793 | $28,817 | $7,560 | $21,257 |
| 2014 | $793 | $28,817 | $7,560 | $21,257 |
Source: Public Records
Map
Nearby Homes
- 8876 Cave Spring
- 8876 Cave Spring Rd SW
- 0 Mill Rd Unit 10629874
- 0 Mill Rd Unit 7670319
- 10 Ridge Rd SW
- 104 Fincher St
- 57 Mill St
- 22 River St SW
- 5598 Fosters Mill Rd
- 5677 Fosters Mill Rd SW
- 7 Herschel Mize Dr SW
- 7 Herschel Mize Dr
- 0 Melson Rd SW Unit 7676052
- 0 Melson Rd SW Unit 10636997
- 0 McGee Bend Rd SW Unit 10351960
- 907 Gadsden Rd SW
- 5165 Cave Spring Rd SW
- 0 Old Blacks Bluff Rd SW Unit 10652523
- 0 Booger Hollow Rd
- 424 Michael Blvd
- 7324 Cave Spring Rd SW
- 7326 Cave Spring Rd SW
- 1853 Spout Springs Rd SW
- 1839 Spout Springs Rd SW
- 0 Davis Rd SW Unit 7028594
- 0 Davis Rd SW Unit 8054005
- 7288 Cave Spring Rd SW
- 7286 Cave Spring Rd SW
- 7285 Cave Spring Rd SW
- 7339 Cave Spring Rd SW
- 7295 Cave Spring Rd SW
- 1821 Spout Springs Rd SW
- 7252 Cave Spring Rd SW
- 7271 Cave Spring Rd SW
- 7255 Cave Spring Rd SW
- 7385 Cave Spring Rd SW
- 55 Rome Rd SW
- 1801 Spout Springs Rd SW
- 7242 Cave Spring Rd SW Unit 13,14,15
- 7242 Cave Spring Rd SW