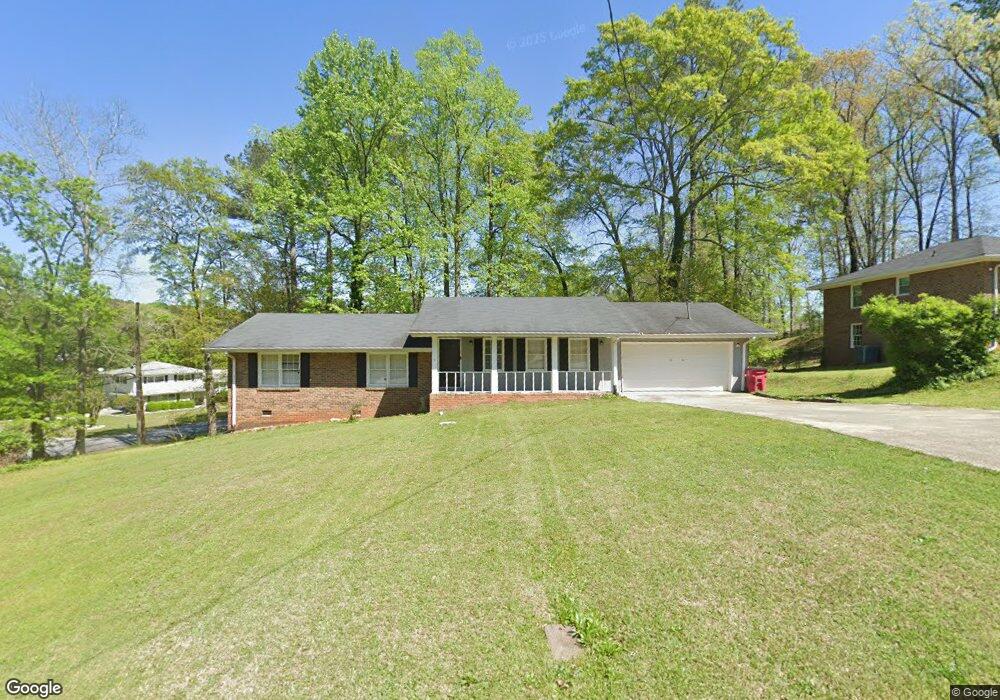
7328 Czar Place Riverdale, GA 30296
Estimated Value: $232,000 - $285,000
4
Beds
2
Baths
1,658
Sq Ft
$155/Sq Ft
Est. Value
About This Home
This home is located at 7328 Czar Place, Riverdale, GA 30296 and is currently estimated at $257,639, approximately $155 per square foot. 7328 Czar Place is a home located in Clayton County with nearby schools including Oliver Elementary School, Riverdale Middle School, and North Clayton High School.
Ownership History
Date
Name
Owned For
Owner Type
Purchase Details
Closed on
Apr 23, 2025
Sold by
Rh Partners Ownerco Llc
Bought by
Rh Partners Ownerco 2 Llc
Current Estimated Value
Purchase Details
Closed on
Oct 25, 2018
Sold by
Arvm 5 Llc
Bought by
Sfr Assets Owner Llc and C/O Main Street Renewal
Purchase Details
Closed on
Aug 1, 2017
Sold by
Freeman Phyllis
Bought by
Arvm 5 Llc
Purchase Details
Closed on
Sep 2, 2005
Sold by
Swint Swint R and Swint Brenda
Bought by
Freeman Phyllis
Home Financials for this Owner
Home Financials are based on the most recent Mortgage that was taken out on this home.
Original Mortgage
$108,800
Interest Rate
7.05%
Mortgage Type
New Conventional
Purchase Details
Closed on
Sep 6, 2002
Sold by
Swint Roger
Bought by
Swint Swint R and Swint Brenda D
Home Financials for this Owner
Home Financials are based on the most recent Mortgage that was taken out on this home.
Original Mortgage
$85,000
Interest Rate
6.3%
Mortgage Type
New Conventional
Create a Home Valuation Report for This Property
The Home Valuation Report is an in-depth analysis detailing your home's value as well as a comparison with similar homes in the area
Home Values in the Area
Average Home Value in this Area
Purchase History
| Date | Buyer | Sale Price | Title Company |
|---|---|---|---|
| Rh Partners Ownerco 2 Llc | $36,908,116 | -- | |
| Sfr Assets Owner Llc | $136,966 | -- | |
| Arvm 5 Llc | $85,000 | -- | |
| Freeman Phyllis | $136,000 | -- | |
| Swint Swint R | -- | -- |
Source: Public Records
Mortgage History
| Date | Status | Borrower | Loan Amount |
|---|---|---|---|
| Previous Owner | Freeman Phyllis | $108,800 | |
| Previous Owner | Swint Swint R | $85,000 |
Source: Public Records
Tax History Compared to Growth
Tax History
| Year | Tax Paid | Tax Assessment Tax Assessment Total Assessment is a certain percentage of the fair market value that is determined by local assessors to be the total taxable value of land and additions on the property. | Land | Improvement |
|---|---|---|---|---|
| 2024 | $3,650 | $95,400 | $8,000 | $87,400 |
| 2023 | $2,585 | $71,600 | $8,000 | $63,600 |
| 2022 | $2,855 | $71,600 | $8,000 | $63,600 |
| 2021 | $2,136 | $72,520 | $8,000 | $64,520 |
| 2020 | $2,162 | $52,931 | $8,000 | $44,931 |
| 2019 | $1,945 | $46,794 | $6,000 | $40,794 |
| 2018 | $1,230 | $34,341 | $6,000 | $28,341 |
| 2017 | $479 | $30,105 | $6,000 | $24,105 |
| 2016 | $344 | $23,824 | $6,000 | $17,824 |
| 2015 | $370 | $0 | $0 | $0 |
| 2014 | $341 | $24,784 | $6,000 | $18,784 |
Source: Public Records
Map
Nearby Homes
- 7325 Czar Place
- 7438 Ambassador Dr
- 1612 Envoy Place
- 1529 Winchester Trail
- 1553 Sultan Ln
- 7125 W Fayetteville Rd
- 7111 W Fayetteville Rd
- 1584 Nations Trail
- 150 Old Highway 138
- 7396 Petunia Dr
- 1505 Diplomat Dr
- 1467 Diplomat Dr
- 1418 Winchester Trail
- 1445 Diplomat Dr
- 7179 Bryce Rd
- 1464 Riverrock Trail
- 0 Creekside Ln Unit 10582617
- 0 Creekside Ln Unit 7631178
- 1712 Bethaven Rd
- 7328 Czar Place
- 7346 Czar Place
- 1604 Coronet Dr
- 1613 Coronet Dr
- 1625 Coronet Dr
- 7337 Czar Place
- 1636 Coronet Dr
- 7347 Czar Place Unit 5
- 1633 Coronet Dr Unit 5
- 1740 Nations Trail
- 1746 Nations Trail
- 1746 Nations Trail Unit 59
- 1738 Nations Trail
- 1601 Coronet Dr
- 1750 Nations Trail
- 1732 Nations Trail
- 1600 Coronet Dr
- 1597 Coronet Dr
- 1754 Nations Trail
- 1641 Coronet Dr