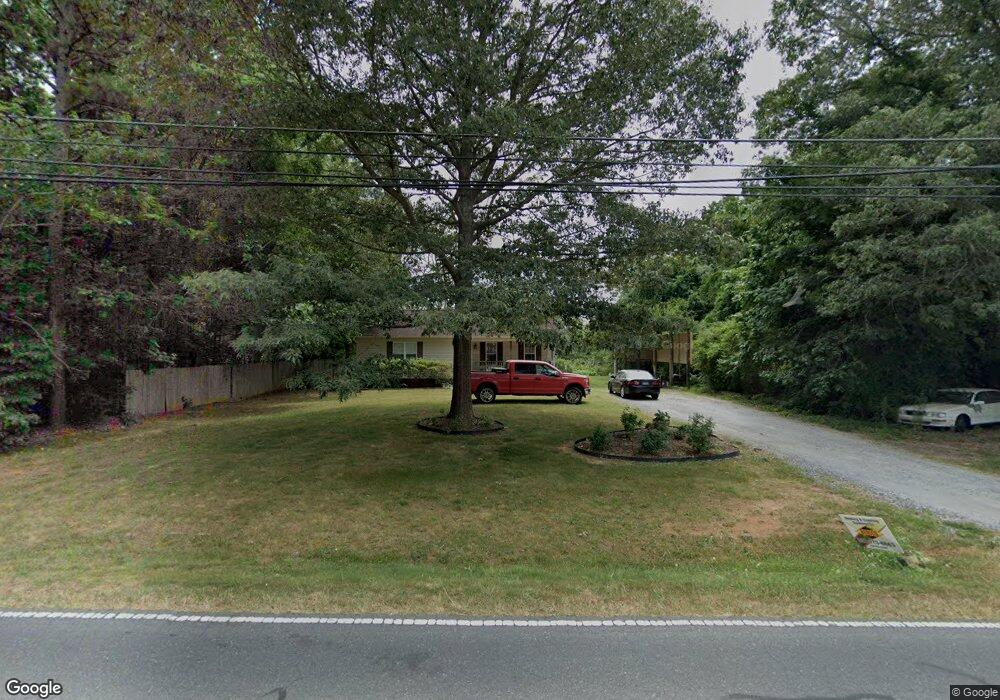
7329 Flint Hill Rd Sophia, NC 27350
Estimated Value: $221,633 - $257,000
--
Bed
2
Baths
1,155
Sq Ft
$207/Sq Ft
Est. Value
About This Home
This home is located at 7329 Flint Hill Rd, Sophia, NC 27350 and is currently estimated at $239,408, approximately $207 per square foot. 7329 Flint Hill Rd is a home located in Randolph County with nearby schools including New Market Elementary School, Randleman Middle School, and Randleman High School.
Ownership History
Date
Name
Owned For
Owner Type
Purchase Details
Closed on
Mar 5, 2020
Sold by
Carpenter Christopher E and Carpenter Jamie M
Bought by
Cook Jacob T
Current Estimated Value
Home Financials for this Owner
Home Financials are based on the most recent Mortgage that was taken out on this home.
Original Mortgage
$117,000
Outstanding Balance
$105,255
Interest Rate
4.37%
Mortgage Type
New Conventional
Estimated Equity
$134,153
Purchase Details
Closed on
Apr 20, 2007
Sold by
Carpenter Jamie M and Sykes Jamie M
Bought by
Carpenter Christopher E and Carpenter Jamie M
Home Financials for this Owner
Home Financials are based on the most recent Mortgage that was taken out on this home.
Original Mortgage
$101,700
Interest Rate
6.1%
Mortgage Type
New Conventional
Purchase Details
Closed on
Jun 25, 2001
Bought by
Carpenter Christopher E Carpenter
Purchase Details
Closed on
Jun 20, 1996
Bought by
Carpenter Christopher E Carpenter
Create a Home Valuation Report for This Property
The Home Valuation Report is an in-depth analysis detailing your home's value as well as a comparison with similar homes in the area
Home Values in the Area
Average Home Value in this Area
Purchase History
| Date | Buyer | Sale Price | Title Company |
|---|---|---|---|
| Cook Jacob T | $115,000 | None Available | |
| Carpenter Christopher E | -- | Southeast Equity Title | |
| Carpenter Christopher E Carpenter | $95,000 | -- | |
| Carpenter Christopher E Carpenter | $10,000 | -- |
Source: Public Records
Mortgage History
| Date | Status | Borrower | Loan Amount |
|---|---|---|---|
| Open | Cook Jacob T | $117,000 | |
| Previous Owner | Carpenter Christopher E | $101,700 |
Source: Public Records
Tax History Compared to Growth
Tax History
| Year | Tax Paid | Tax Assessment Tax Assessment Total Assessment is a certain percentage of the fair market value that is determined by local assessors to be the total taxable value of land and additions on the property. | Land | Improvement |
|---|---|---|---|---|
| 2024 | $1,243 | $191,280 | $32,000 | $159,280 |
| 2023 | $1,243 | $191,280 | $32,000 | $159,280 |
| 2022 | $854 | $109,070 | $20,000 | $89,070 |
| 2021 | $854 | $109,070 | $20,000 | $89,070 |
| 2020 | $846 | $109,070 | $20,000 | $89,070 |
| 2019 | $846 | $109,070 | $20,000 | $89,070 |
| 2018 | $727 | $90,570 | $11,500 | $79,070 |
| 2016 | $709 | $90,567 | $11,500 | $79,067 |
| 2015 | $711 | $90,567 | $11,500 | $79,067 |
| 2014 | $711 | $90,567 | $11,500 | $79,067 |
Source: Public Records
Map
Nearby Homes
- 2970 Jess Smith Rd
- 8171 Hillsville Rd
- 8316 Hillsville Rd
- 3041 Wesley Farm Ln
- 2987 Wesley Farm Ln
- 2991 Wesley Farm Ln
- 3027 Wesley Farm Ln
- 4124 Skyview Ct
- 3774 Hoover Hill Rd
- 2761 Apache Trail
- 107 Royal Pines Dr
- 3422 Sparky Ln
- 5335 Kennedy Rd
- 0 Cedar Wood Dr
- 9409 Archdale Rd
- 4623 Redding Ct
- 4628 Riverview Dr
- 000 Cedar Wood Dr
- 3786 Beech Cir
- 3269 Earnhardt Rd
- 7319 Flint Hill Rd
- 3732 Jess Smith Rd
- 7336 Flint Hill Rd
- 7324 Flint Hill Rd
- 7409 Flint Hill Rd
- 7289 Flint Hill Rd
- 3232 Giant Oaks Dr
- 7414 Flint Hill Rd
- 7435 Flint Hill Rd
- 3231 Giant Oaks Dr
- 3254 Giant Oaks Dr
- 3824 Level Plains Rd
- 7441 Flint Hill Rd
- 7428 Flint Hill Rd
- 3820 Level Plains Rd
- 7275 Flint Hill Rd
- 3826 Level Plains Rd
- 3652 Jess Smith Rd
- 3237 Giant Oaks Dr
- 7448 Flint Hill Rd