733 Brethour Ct Unit 5 Sterling, VA 20164
Estimated Value: $384,000 - $387,493
2
Beds
2
Baths
1,335
Sq Ft
$289/Sq Ft
Est. Value
About This Home
This home is located at 733 Brethour Ct Unit 5, Sterling, VA 20164 and is currently estimated at $386,373, approximately $289 per square foot. 733 Brethour Ct Unit 5 is a home located in Loudoun County with nearby schools including Sugarland Elementary School, Seneca Ridge Middle School, and Dominion High School.
Ownership History
Date
Name
Owned For
Owner Type
Purchase Details
Closed on
Nov 12, 2014
Sold by
Vo Lee T
Bought by
M Y M Llc
Current Estimated Value
Purchase Details
Closed on
Jun 4, 2008
Sold by
Fannie Mae
Bought by
Vo Hoa T
Home Financials for this Owner
Home Financials are based on the most recent Mortgage that was taken out on this home.
Original Mortgage
$127,800
Interest Rate
6.11%
Mortgage Type
New Conventional
Purchase Details
Closed on
Jul 29, 2005
Sold by
Bonilla Sebastian
Bought by
Melendez Leticia Tobias and Calderon Pedro German R
Home Financials for this Owner
Home Financials are based on the most recent Mortgage that was taken out on this home.
Original Mortgage
$330,000
Interest Rate
5.67%
Mortgage Type
New Conventional
Purchase Details
Closed on
Sep 30, 1996
Sold by
Campana Rinaldo A
Bought by
Bonilla Sebastian
Home Financials for this Owner
Home Financials are based on the most recent Mortgage that was taken out on this home.
Original Mortgage
$92,850
Interest Rate
7.83%
Create a Home Valuation Report for This Property
The Home Valuation Report is an in-depth analysis detailing your home's value as well as a comparison with similar homes in the area
Home Values in the Area
Average Home Value in this Area
Purchase History
| Date | Buyer | Sale Price | Title Company |
|---|---|---|---|
| M Y M Llc | $205,000 | -- | |
| Vo Hoa T | $142,000 | -- | |
| Melendez Leticia Tobias | $330,000 | -- | |
| Bonilla Sebastian | $94,500 | -- |
Source: Public Records
Mortgage History
| Date | Status | Borrower | Loan Amount |
|---|---|---|---|
| Previous Owner | Vo Hoa T | $127,800 | |
| Previous Owner | Melendez Leticia Tobias | $330,000 | |
| Previous Owner | Bonilla Sebastian | $92,850 |
Source: Public Records
Tax History Compared to Growth
Tax History
| Year | Tax Paid | Tax Assessment Tax Assessment Total Assessment is a certain percentage of the fair market value that is determined by local assessors to be the total taxable value of land and additions on the property. | Land | Improvement |
|---|---|---|---|---|
| 2025 | $2,955 | $367,070 | $125,000 | $242,070 |
| 2024 | $2,879 | $332,840 | $125,000 | $207,840 |
| 2023 | $2,790 | $318,850 | $125,000 | $193,850 |
| 2022 | $2,793 | $313,790 | $115,000 | $198,790 |
| 2021 | $2,676 | $273,060 | $75,000 | $198,060 |
| 2020 | $2,797 | $270,220 | $62,000 | $208,220 |
| 2019 | $2,535 | $242,590 | $62,000 | $180,590 |
| 2018 | $2,565 | $236,400 | $62,000 | $174,400 |
| 2017 | $2,471 | $219,610 | $62,000 | $157,610 |
| 2016 | $2,395 | $209,140 | $0 | $0 |
| 2015 | $2,381 | $147,800 | $0 | $147,800 |
| 2014 | $2,221 | $130,300 | $0 | $130,300 |
Source: Public Records
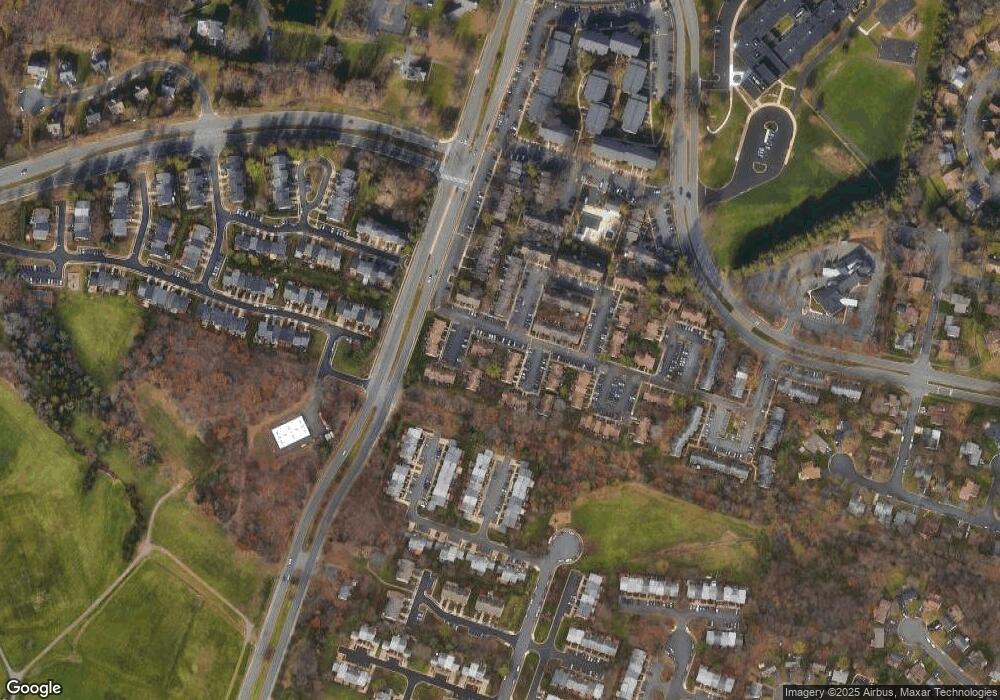
Map
Nearby Homes
- 100 Marcum Ct
- 502 Giles Place
- 500 Giles Place
- 46699 Paragon Terrace
- 21073 Semblance Dr
- 25 Jefferson Dr
- 86 Sugarland Run Dr
- 110 Sugarland Run Dr
- 105 Woodgate Ct
- 21228 Mcfadden Square Unit 411
- 203 Greenfield Ct
- 20687 Smithfield Ct
- 26 Carousel Ct
- 46823 Gunflint Way
- 23 Monarch Dr
- 46212 Wales Terrace
- 46809 Trailwood Place
- 20597 Glenmere Square
- 104 W Amhurst Place
- 126 Hillsdale Dr
- 733 Brethour Ct
- 735 Brethour Ct
- 731 Brethour Ct
- 731 Brethour Ct Unit 6
- 737 Brethour Ct
- 729 Brethour Ct
- 739 Brethour Ct
- 741 Brethour Ct
- 725 Brethour Ct
- 725 Brethour Ct Unit 9
- 727 Brethour Ct Unit 8
- 727 Brethour Ct
- 723 Brethour Ct
- 721 Brethour Ct
- 719 Brethour Ct
- 707 Brethour Ct
- 717 Brethour Ct
- 705 Brethour Ct Unit 20
- 705 Brethour Ct