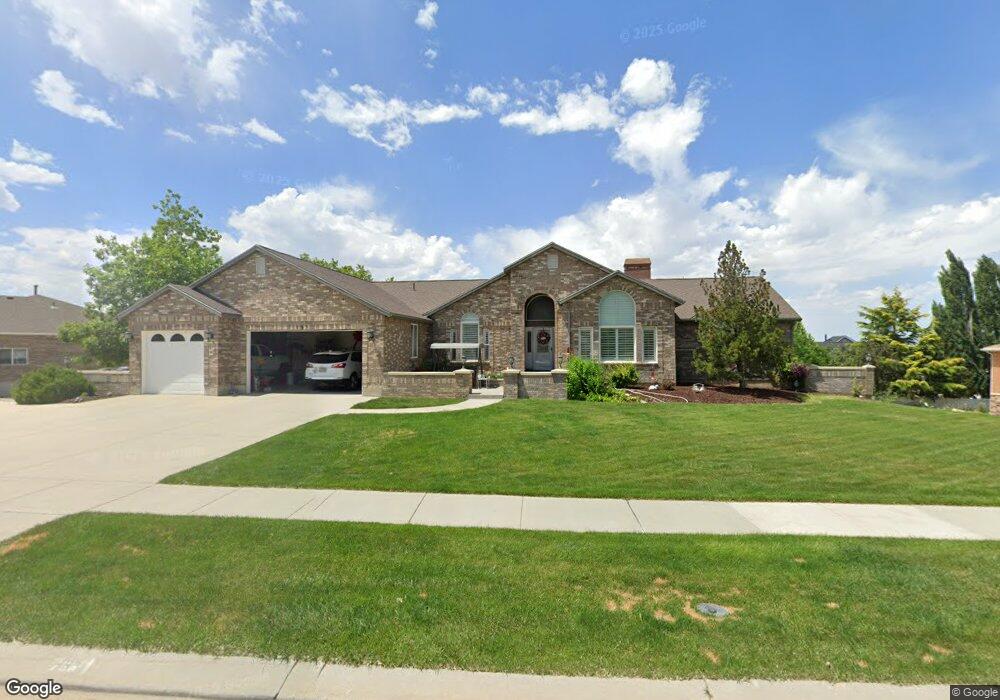
733 E Southfork Dr Draper, UT 84020
Estimated Value: $850,000 - $1,241,000
3
Beds
4
Baths
2,584
Sq Ft
$419/Sq Ft
Est. Value
About This Home
This home is located at 733 E Southfork Dr, Draper, UT 84020 and is currently estimated at $1,083,326, approximately $419 per square foot. 733 E Southfork Dr is a home located in Salt Lake County with nearby schools including Draper Elementary School, Draper Park Middle School, and Corner Canyon High School.
Ownership History
Date
Name
Owned For
Owner Type
Purchase Details
Closed on
Sep 21, 1998
Sold by
Saunders Michael G and Saunders Stephanie
Bought by
Saunders Stephanie and Saunders Michael G
Current Estimated Value
Purchase Details
Closed on
Nov 22, 1994
Sold by
Hogle Family Ltd Partnership
Bought by
Saunders Michael G and Saunders Stephanie
Home Financials for this Owner
Home Financials are based on the most recent Mortgage that was taken out on this home.
Original Mortgage
$130,000
Interest Rate
8.92%
Purchase Details
Closed on
Feb 16, 1994
Sold by
Celebrity Homes Inc
Bought by
Hogle Family Ltd Partnership
Create a Home Valuation Report for This Property
The Home Valuation Report is an in-depth analysis detailing your home's value as well as a comparison with similar homes in the area
Home Values in the Area
Average Home Value in this Area
Purchase History
| Date | Buyer | Sale Price | Title Company |
|---|---|---|---|
| Saunders Stephanie | -- | -- | |
| Saunders Michael G | -- | -- | |
| Hogle Family Ltd Partnership | -- | -- |
Source: Public Records
Mortgage History
| Date | Status | Borrower | Loan Amount |
|---|---|---|---|
| Previous Owner | Saunders Michael G | $130,000 |
Source: Public Records
Tax History
| Year | Tax Paid | Tax Assessment Tax Assessment Total Assessment is a certain percentage of the fair market value that is determined by local assessors to be the total taxable value of land and additions on the property. | Land | Improvement |
|---|---|---|---|---|
| 2025 | $4,975 | $1,066,200 | $269,500 | $796,700 |
| 2024 | $4,975 | $950,300 | $254,200 | $696,100 |
| 2023 | $4,635 | $879,000 | $250,400 | $628,600 |
| 2022 | $4,794 | $878,100 | $245,500 | $632,600 |
| 2021 | $4,337 | $678,600 | $199,300 | $479,300 |
| 2020 | $4,066 | $603,100 | $184,600 | $418,500 |
| 2019 | $3,438 | $498,200 | $174,100 | $324,100 |
Source: Public Records
Map
Nearby Homes
- 760 E Corner Ridge Dr
- 13898 Summerset Cir
- 14119 S Senior Band Rd
- 957 Senior Band Rd
- 919 E Rocky Mouth Ln
- 14044 Pepi Band Rd
- 919 E 13800 S
- 928 E Rocky Mouth Ln
- 645 E Rocky Mouth Ln
- 14793 S Vintage View Ln Unit 14
- 13164 S City Point Cove Unit 1
- 1314 E Victor Ln
- 13189 S City Point Cove E Unit 4
- 1349 E Elk Unit 33
- 587 Corner Canyon Dr
- 455 E Rocky Mouth Ln
- 13448 Saddle Ridge Dr
- 284 E Concord Farm Ln Unit 8
- 14374 S Champ Cove Unit 138
- 963 Old English Rd
- 733 E Southfork Dr
- 721 Southfork Dr
- 721 E Southfork Dr
- 741 E Southfork Dr
- 741 Southfork Dr
- 13975 Corner Hills Cove
- 13975 S Corner Hills Cove
- 13972 S Corner Hills Cove
- 13972 Corner Hills Cove
- 744 E Southfork Dr
- 732 Southfork Dr
- 732 E Southfork Dr
- 744 Southfork Dr
- 13997 Osborne Ln
- 14017 Osborne Ln
- 14017 S Osborne Ln
- 722 Southfork Dr
- 722 E Southfork Dr
- 14004 Point Hills Cove
- 14004 S Point Hills Cove