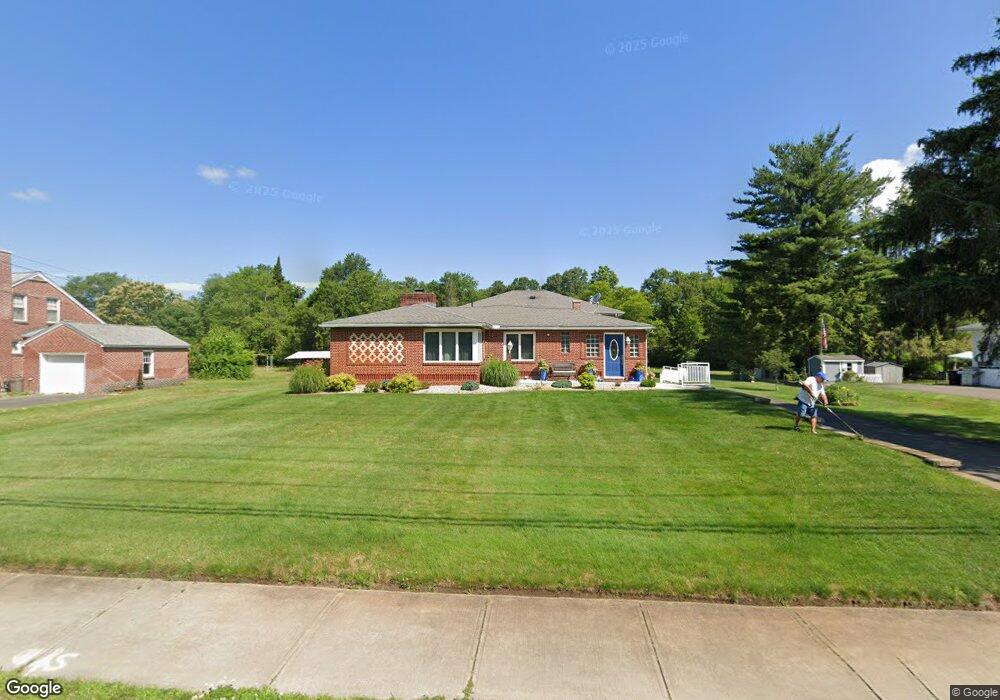
733 East St Ludlow, MA 01056
Estimated Value: $388,000 - $506,000
4
Beds
2
Baths
2,325
Sq Ft
$191/Sq Ft
Est. Value
About This Home
This home is located at 733 East St, Ludlow, MA 01056 and is currently estimated at $443,539, approximately $190 per square foot. 733 East St is a home located in Hampden County with nearby schools including East Street Elementary School, Chapin Street Elementary School, and Paul R. Baird Middle School.
Ownership History
Date
Name
Owned For
Owner Type
Purchase Details
Closed on
Aug 22, 2017
Sold by
Balbino Alda M and Balbino Fernando M
Bought by
Despina Simons Ret and Simons
Current Estimated Value
Purchase Details
Closed on
Aug 9, 1990
Sold by
Quiterio Bonnie R
Bought by
Balbino Alda M
Create a Home Valuation Report for This Property
The Home Valuation Report is an in-depth analysis detailing your home's value as well as a comparison with similar homes in the area
Home Values in the Area
Average Home Value in this Area
Purchase History
| Date | Buyer | Sale Price | Title Company |
|---|---|---|---|
| Despina Simons Ret | -- | -- | |
| Despina Simons Ret | -- | -- | |
| Balbino Alda M | $118,000 | -- |
Source: Public Records
Mortgage History
| Date | Status | Borrower | Loan Amount |
|---|---|---|---|
| Previous Owner | Balbino Alda M | $30,000 | |
| Previous Owner | Balbino Alda M | $15,000 | |
| Previous Owner | Balbino Alda M | $65,000 | |
| Previous Owner | Balbino Alda M | $85,000 |
Source: Public Records
Tax History Compared to Growth
Tax History
| Year | Tax Paid | Tax Assessment Tax Assessment Total Assessment is a certain percentage of the fair market value that is determined by local assessors to be the total taxable value of land and additions on the property. | Land | Improvement |
|---|---|---|---|---|
| 2025 | $7,804 | $449,800 | $78,800 | $371,000 |
| 2024 | $7,267 | $401,700 | $78,800 | $322,900 |
| 2023 | $7,008 | $359,200 | $69,100 | $290,100 |
| 2022 | $6,587 | $329,500 | $69,100 | $260,400 |
| 2021 | $6,543 | $310,400 | $69,100 | $241,300 |
| 2020 | $6,262 | $303,700 | $68,100 | $235,600 |
| 2019 | $5,898 | $297,600 | $67,400 | $230,200 |
| 2018 | $5,505 | $289,600 | $67,400 | $222,200 |
| 2017 | $5,416 | $292,300 | $66,100 | $226,200 |
| 2016 | $5,075 | $279,900 | $64,800 | $215,100 |
Source: Public Records
Map
Nearby Homes
- 142 Amherst St
- 138 Ridgeview Cir
- 148 Yale St
- 51 Newcrest St
- 51 Parkview St
- 415 Winsor St
- 41 Orchard St
- 87 Haviland St
- 37 Franklin St
- 287 East St
- 70 Sroka Ln
- 32 White St
- 45 Meadow St
- 84 Chapin Greene Dr
- 517 Ideal Ln Unit 401
- 24 Elm St
- 2205 Boston Rd Unit N135A
- 2205 Boston Rd Unit I 82
- 42 Loopley St
- 60 Loopley St