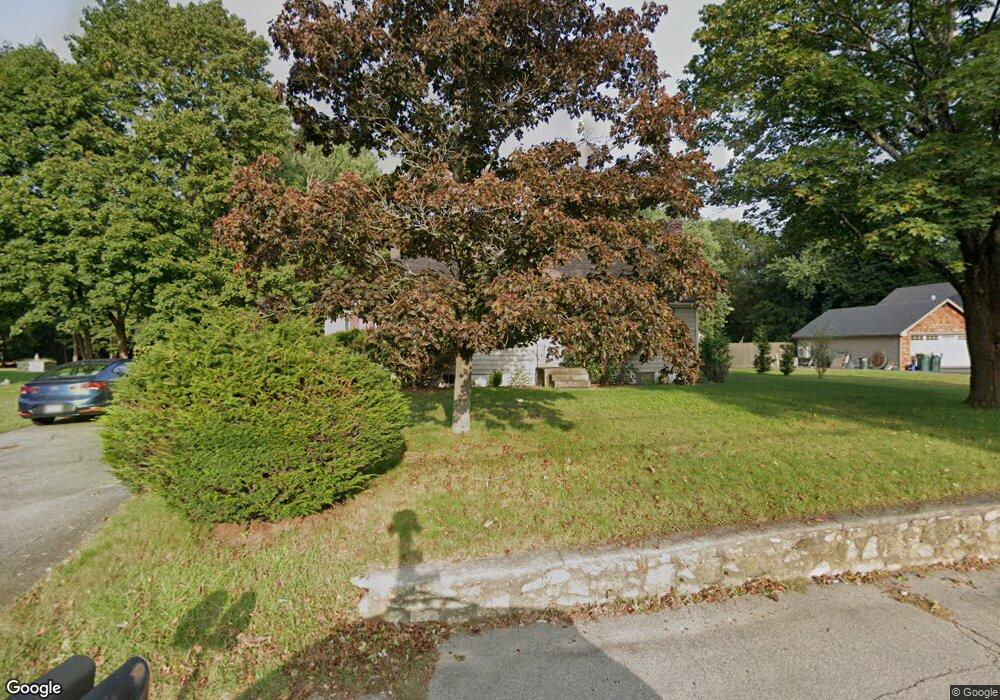
733 Hancock St Abington, MA 02351
Estimated Value: $580,000 - $621,000
4
Beds
2
Baths
1,701
Sq Ft
$349/Sq Ft
Est. Value
About This Home
This home is located at 733 Hancock St, Abington, MA 02351 and is currently estimated at $593,884, approximately $349 per square foot. 733 Hancock St is a home located in Plymouth County with nearby schools including Woodsdale School, Beaver Brook Elementary School, and Abington Middle School.
Ownership History
Date
Name
Owned For
Owner Type
Purchase Details
Closed on
May 17, 2004
Sold by
Fenderson Marion E
Bought by
Boyd Jeanne M
Current Estimated Value
Home Financials for this Owner
Home Financials are based on the most recent Mortgage that was taken out on this home.
Original Mortgage
$299,875
Interest Rate
5.47%
Mortgage Type
Purchase Money Mortgage
Create a Home Valuation Report for This Property
The Home Valuation Report is an in-depth analysis detailing your home's value as well as a comparison with similar homes in the area
Home Values in the Area
Average Home Value in this Area
Purchase History
| Date | Buyer | Sale Price | Title Company |
|---|---|---|---|
| Boyd Jeanne M | $299,900 | -- |
Source: Public Records
Mortgage History
| Date | Status | Borrower | Loan Amount |
|---|---|---|---|
| Open | Boyd Jeanne M | $280,000 | |
| Closed | Boyd Jeanne M | $35,000 | |
| Closed | Boyd Jeanne M | $299,875 |
Source: Public Records
Tax History Compared to Growth
Tax History
| Year | Tax Paid | Tax Assessment Tax Assessment Total Assessment is a certain percentage of the fair market value that is determined by local assessors to be the total taxable value of land and additions on the property. | Land | Improvement |
|---|---|---|---|---|
| 2025 | $6,439 | $493,000 | $246,700 | $246,300 |
| 2024 | $6,416 | $479,500 | $225,000 | $254,500 |
| 2023 | $6,098 | $429,100 | $196,600 | $232,500 |
| 2022 | $6,222 | $408,800 | $173,000 | $235,800 |
| 2021 | $5,679 | $344,600 | $157,600 | $187,000 |
| 2020 | $5,780 | $340,000 | $153,000 | $187,000 |
| 2019 | $5,478 | $315,000 | $146,100 | $168,900 |
| 2018 | $5,481 | $307,600 | $146,100 | $161,500 |
| 2017 | $5,032 | $274,200 | $146,100 | $128,100 |
| 2016 | $4,665 | $260,200 | $139,500 | $120,700 |
| 2015 | $4,347 | $255,700 | $139,500 | $116,200 |
Source: Public Records
Map
Nearby Homes
- 840 Hancock St
- 451 Lincoln St
- 14 Kingswood Dr Unit 3
- 5 Chamberlain St
- 337 Randolph St
- 89 Presidential Dr
- 14 Jamieson St
- 332 Hancock St
- 28 Sylvan Ct
- 209 Hancock St
- 164 Hancock St
- 44 Old Forge Rd
- 116 Hancock St
- 1353 Washington St
- 0 Bedford St
- 29 Belair Dr
- 1085 Bedford St
- 1077 Bedford St
- 676 Bedford St
- 1210 Washington St
- 725 Hancock St
- 740 Hancock St
- 743 Hancock St
- 728 Hancock St
- 759 Hancock St
- 719 Hancock St
- 720 Hancock St
- 744 Hancock St
- 764 Hancock St
- 775 Hancock St
- 707 Hancock St
- 704 Hancock St
- 783 Hancock St
- 780 Hancock St
- 695 Hancock St
- 791 Hancock St
- 792 Hancock St
- 28 John St
- 36 John L Sullivan Way
- 683 Hancock St