Estimated Value: $234,411 - $250,000
3
Beds
1
Bath
1,063
Sq Ft
$229/Sq Ft
Est. Value
About This Home
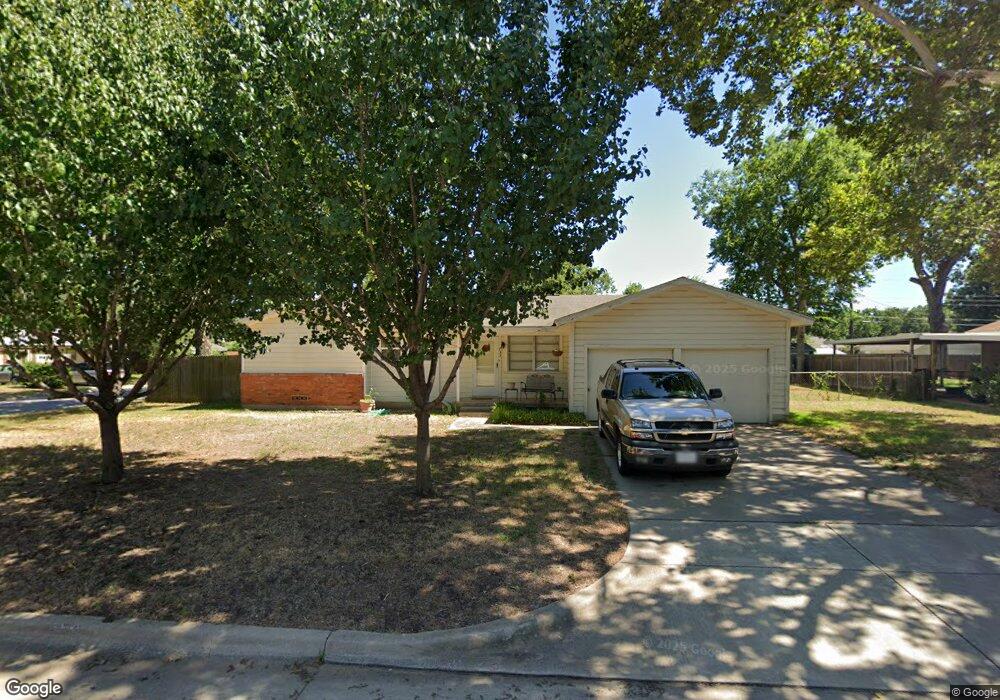
This home is located at 733 Henson Dr, Hurst, TX 76053 and is currently estimated at $243,103, approximately $228 per square foot. 733 Henson Dr is a home located in Tarrant County with nearby schools including West Hurst Elementary School, Hurst J High School, and L.D. Bell High School.
Ownership History
Date
Name
Owned For
Owner Type
Purchase Details
Closed on
Mar 4, 2015
Sold by
Kozak Susan Leigh
Bought by
Kozak Robert James
Current Estimated Value
Home Financials for this Owner
Home Financials are based on the most recent Mortgage that was taken out on this home.
Original Mortgage
$66,998
Outstanding Balance
$51,408
Interest Rate
3.73%
Mortgage Type
Purchase Money Mortgage
Estimated Equity
$191,695
Purchase Details
Closed on
Sep 20, 2004
Sold by
Witham Mary Solis and Witham Peter
Bought by
Kozak Robert J and Kozak Susan L
Home Financials for this Owner
Home Financials are based on the most recent Mortgage that was taken out on this home.
Original Mortgage
$60,800
Interest Rate
5.86%
Mortgage Type
Purchase Money Mortgage
Purchase Details
Closed on
May 18, 2001
Sold by
Henderson Patrick A
Bought by
Whitman Mary Solis and Henderson Mary Solis
Create a Home Valuation Report for This Property
The Home Valuation Report is an in-depth analysis detailing your home's value as well as a comparison with similar homes in the area
Home Values in the Area
Average Home Value in this Area
Purchase History
| Date | Buyer | Sale Price | Title Company |
|---|---|---|---|
| Kozak Robert James | -- | None Available | |
| Kozak Robert J | -- | First Land Title | |
| Whitman Mary Solis | -- | -- |
Source: Public Records
Mortgage History
| Date | Status | Borrower | Loan Amount |
|---|---|---|---|
| Open | Kozak Robert James | $66,998 | |
| Closed | Kozak Robert J | $60,800 | |
| Closed | Whitman Mary Solis | $0 | |
| Closed | Kozak Robert J | $15,200 |
Source: Public Records
Tax History
| Year | Tax Paid | Tax Assessment Tax Assessment Total Assessment is a certain percentage of the fair market value that is determined by local assessors to be the total taxable value of land and additions on the property. | Land | Improvement |
|---|---|---|---|---|
| 2025 | $1,717 | $225,819 | $60,000 | $165,819 |
| 2024 | $1,717 | $225,819 | $60,000 | $165,819 |
| 2023 | $2,697 | $221,907 | $30,000 | $191,907 |
| 2022 | $2,818 | $186,368 | $30,000 | $156,368 |
| 2021 | $2,683 | $168,206 | $30,000 | $138,206 |
| 2020 | $2,433 | $134,447 | $30,000 | $104,447 |
| 2019 | $2,250 | $134,447 | $30,000 | $104,447 |
| 2018 | $1,567 | $83,587 | $18,000 | $65,587 |
| 2017 | $1,923 | $118,170 | $18,000 | $100,170 |
| 2016 | $1,748 | $103,654 | $18,000 | $85,654 |
| 2015 | $1,296 | $62,800 | $12,000 | $50,800 |
| 2014 | $1,296 | $62,800 | $12,000 | $50,800 |
Source: Public Records
Map
Nearby Homes
- 408 Simmons Dr
- 416 Simmons Dr
- 637 Post Oak Dr
- 780 Betty Ln
- 608 W Redbud Dr
- 808 Betty Ct
- 800 Treadwell Ct Unit 800B
- 758 Briarwood Ln
- 756 Briarwood Ln
- 721 Briarwood Ln
- 852 W Redbud Dr
- 709 Hurstview Dr
- 661 Oak Dr
- 528 Buena Vista Dr
- 512 Billie Ruth Ln
- 540 Billie Ruth Ln
- 813 Chase Cir
- 3216 Fountain Pkwy
- 420 Twin Creek Dr
- 47 Donald Ct
- 321 Anderson Dr
- 737 Henson Dr
- 401 Anderson Dr
- 317 Anderson Dr
- 324 Anderson Dr
- 736 Henson Dr
- 741 Henson Dr
- 328 Anderson Dr
- 320 Anderson Dr
- 736 Thomas Ave
- 400 Anderson Dr
- 316 Anderson Dr
- 405 Anderson Dr
- 740 Henson Dr
- 740 Thomas Ave
- 745 Henson Dr
- 404 Anderson Dr
- 312 Anderson Dr
- 744 Henson Dr
- 744 Thomas Ave
Your Personal Tour Guide
Ask me questions while you tour the home.