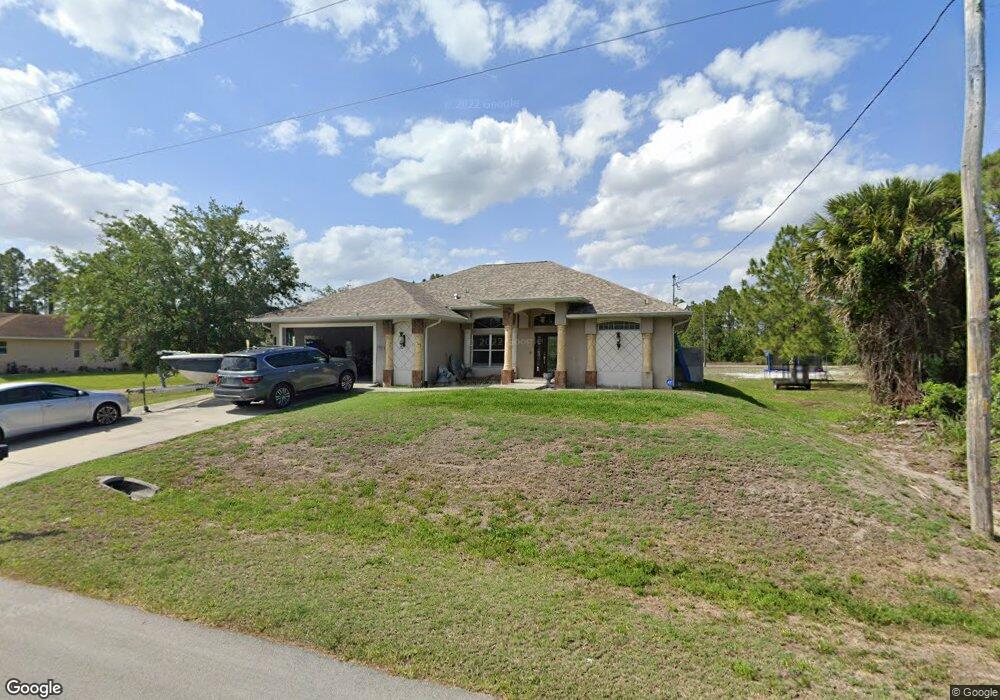
733 Long Island St E Unit 5 Lehigh Acres, FL 33974
Eisenhower NeighborhoodEstimated Value: $315,972 - $399,000
3
Beds
2
Baths
1,823
Sq Ft
$190/Sq Ft
Est. Value
About This Home
This home is located at 733 Long Island St E Unit 5, Lehigh Acres, FL 33974 and is currently estimated at $346,493, approximately $190 per square foot. 733 Long Island St E Unit 5 is a home located in Lee County with nearby schools including Lehigh Elementary School, The Alva School, and Gateway Elementary School.
Ownership History
Date
Name
Owned For
Owner Type
Purchase Details
Closed on
Jul 19, 2013
Sold by
Nationwide Capital Investment Group Llc
Bought by
Cianci Michael
Current Estimated Value
Home Financials for this Owner
Home Financials are based on the most recent Mortgage that was taken out on this home.
Original Mortgage
$129,609
Outstanding Balance
$96,013
Interest Rate
4.37%
Mortgage Type
FHA
Estimated Equity
$250,480
Purchase Details
Closed on
Mar 9, 2013
Sold by
Shutok Robert Alan and Vauter Alena K
Bought by
Nationwide Capital Investment Group Llc
Purchase Details
Closed on
Nov 4, 2006
Sold by
Beauchamp Roy E and Beauchamp Catherine O
Bought by
Shutok Robert Alan and Shutok Alena Katherine
Purchase Details
Closed on
Oct 1, 2005
Sold by
Beauchamp Roy E and Beauchamp Catherine O
Bought by
Beauchamp Roy E and Beauchamp Catherine O
Create a Home Valuation Report for This Property
The Home Valuation Report is an in-depth analysis detailing your home's value as well as a comparison with similar homes in the area
Home Values in the Area
Average Home Value in this Area
Purchase History
| Date | Buyer | Sale Price | Title Company |
|---|---|---|---|
| Cianci Michael | $132,000 | Townsend Title Insurance Age | |
| Nationwide Capital Investment Group Llc | $80,000 | Security Title & Abstract Ll | |
| Shutok Robert Alan | $32,500 | Team Title Insurance Inc | |
| Beauchamp Roy E | -- | None Available |
Source: Public Records
Mortgage History
| Date | Status | Borrower | Loan Amount |
|---|---|---|---|
| Open | Cianci Michael | $129,609 |
Source: Public Records
Tax History Compared to Growth
Tax History
| Year | Tax Paid | Tax Assessment Tax Assessment Total Assessment is a certain percentage of the fair market value that is determined by local assessors to be the total taxable value of land and additions on the property. | Land | Improvement |
|---|---|---|---|---|
| 2025 | $1,887 | $124,513 | -- | -- |
| 2024 | $1,629 | $121,004 | -- | -- |
| 2023 | $1,728 | $117,480 | $0 | $0 |
| 2022 | $1,629 | $114,058 | $0 | $0 |
| 2021 | $1,531 | $194,878 | $4,500 | $190,378 |
| 2020 | $1,523 | $109,207 | $0 | $0 |
| 2019 | $1,521 | $106,752 | $0 | $0 |
| 2018 | $1,490 | $104,762 | $0 | $0 |
| 2017 | $1,450 | $102,607 | $0 | $0 |
| 2016 | $1,415 | $123,965 | $4,250 | $119,715 |
| 2015 | $1,407 | $113,195 | $3,870 | $109,325 |
| 2014 | -- | $99,006 | $2,555 | $96,451 |
| 2013 | -- | $82,104 | $2,100 | $80,004 |
Source: Public Records
Map
Nearby Homes
- 736 Theodore Vail St E
- 510 Edward Hall Ave S
- 523 Harry Thayer Ave S
- 514 Bronx Ave S
- 518 Harry Thayer Ave S
- 521 Frank Jewett Ave S
- 497 Lenox Ave E
- 494 Lemhurst Ave S
- 490 Lemhurst Ave S
- 524 Bronx Ave S
- 542 Upstate Ave S
- 483 Lemhurst Ave
- 818 Chemstrand St E
- 737 Long Island St E
- 807 Theodore Vail St E
- 748 Chattman St E
- 752 Chattman St E
- 512 Empire Ave S
- 802 Kingsbury Ct
- 734 Theodore Vail St
- 729 Long Island St E
- 728 Theodore Vail St E Unit 1
- 510 Edward Hall Ave S Unit 22
- 727 Long Island St E Unit 1
- 739 Long Island St E
- 514 Harry Thayer Ave S
- 735 Theodore Vail St E
- 723 Long Island St E
- 743 Long Island St E
- 529 Harry Thayer Ave S
- 722 Theodore Vail St E
- 722 Theodore Vail St E
- 519 Harry Thayer Ave S
- 725 Theodore Vail St E Unit 1
- 741 Theodore Vail St E
- 745 Long Island St E
- 720 Theodore Vail St E