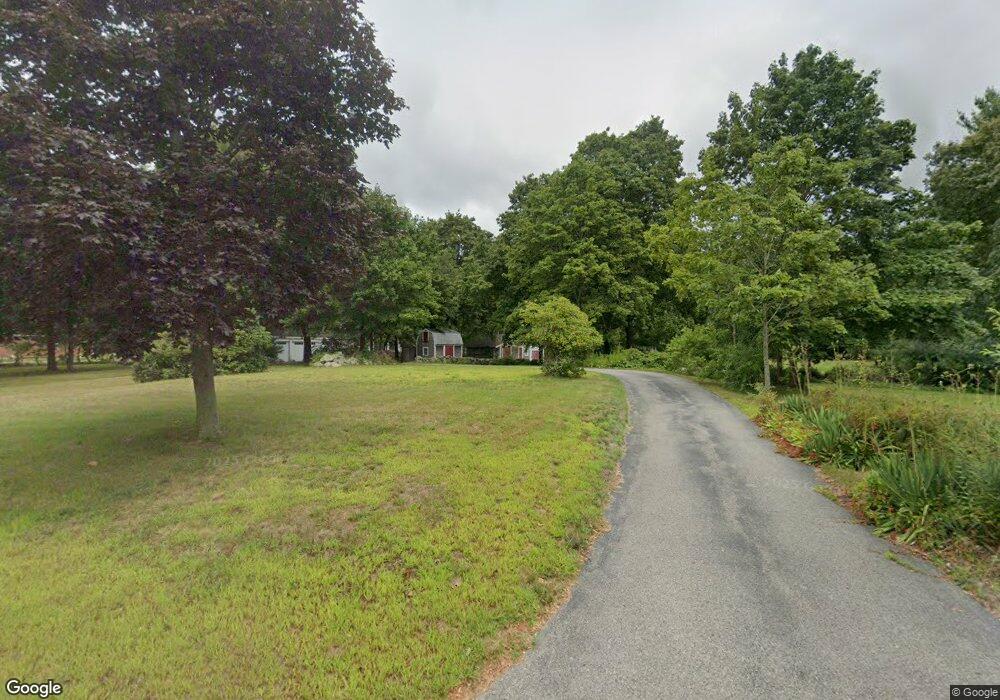
733 Main St Hanover, MA 02339
Estimated Value: $3,525,508
5
Beds
2
Baths
2,546
Sq Ft
$1,385/Sq Ft
Est. Value
About This Home
This home is located at 733 Main St, Hanover, MA 02339 and is currently estimated at $3,525,508, approximately $1,384 per square foot. 733 Main St is a home located in Plymouth County with nearby schools including Hanover High School, South Shore Charter Public School, and The Master's Academy.
Ownership History
Date
Name
Owned For
Owner Type
Purchase Details
Closed on
Oct 20, 2010
Sold by
Whiting Richard A and Whiting Shirley M
Bought by
R & S Ft
Current Estimated Value
Purchase Details
Closed on
Sep 11, 1997
Sold by
Whiting Richard A and Whiting Shirley M
Bought by
Aw Perry South Inc
Purchase Details
Closed on
Jul 23, 1975
Bought by
R & S Ft
Create a Home Valuation Report for This Property
The Home Valuation Report is an in-depth analysis detailing your home's value as well as a comparison with similar homes in the area
Home Values in the Area
Average Home Value in this Area
Purchase History
| Date | Buyer | Sale Price | Title Company |
|---|---|---|---|
| R & S Ft | -- | -- | |
| Aw Perry South Inc | $440,000 | -- | |
| R & S Ft | -- | -- |
Source: Public Records
Mortgage History
| Date | Status | Borrower | Loan Amount |
|---|---|---|---|
| Previous Owner | R & S Ft | $120,000 | |
| Previous Owner | R & S Ft | $31,000 |
Source: Public Records
Tax History Compared to Growth
Tax History
| Year | Tax Paid | Tax Assessment Tax Assessment Total Assessment is a certain percentage of the fair market value that is determined by local assessors to be the total taxable value of land and additions on the property. | Land | Improvement |
|---|---|---|---|---|
| 2025 | $6,949 | $562,700 | $549,000 | $13,700 |
| 2024 | $7,225 | $562,700 | $549,000 | $13,700 |
| 2023 | $7,182 | $532,400 | $518,700 | $13,700 |
| 2022 | $12,038 | $789,400 | $467,800 | $321,600 |
| 2021 | $12,267 | $751,200 | $444,700 | $306,500 |
| 2020 | $12,663 | $776,400 | $444,700 | $331,700 |
| 2019 | $11,789 | $718,400 | $444,700 | $273,700 |
| 2018 | $11,700 | $718,700 | $444,700 | $274,000 |
| 2017 | $10,386 | $628,700 | $439,100 | $189,600 |
| 2016 | $10,382 | $615,800 | $417,500 | $198,300 |
| 2015 | $9,532 | $590,200 | $437,100 | $153,100 |
Source: Public Records
Map
Nearby Homes
- 118 Bates Way
- 53 Chestnut St
- 276 Woodland Dr
- 62 Larchmont Ln
- 375 Webster St
- 216 Whiting St
- 1239 Main St
- 8 Old Farm Rd
- 116 Spring Meadow Ln
- 265 Silver St
- 80 Coolidge Rd
- 7 Assinippi Ave Unit 216
- 7 Assinippi Ave Unit 306
- 120 Deerfield Ln
- 14 Longwood Ln Unit 14
- 141 Deerfield Ln
- 718 Market St
- 114 Main St
- 250 Center St
- 21 King St