733 Main St Hanover, MA 02339
Estimated Value: $3,470,562
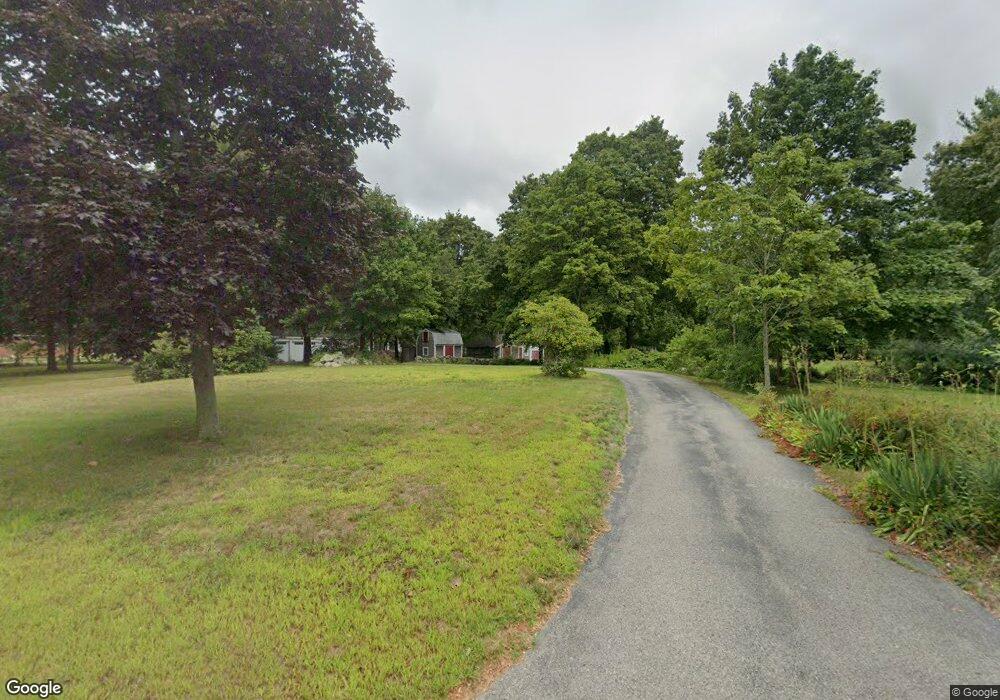
About This Home
This home is located at 733 Main St, Hanover, MA 02339 and is currently estimated at $3,470,562, approximately $1,363 per square foot. 733 Main St is a home located in Plymouth County with nearby schools including Hanover High School, South Shore Charter Public School, and The Master's Academy.
Ownership History
We collect this data history from publicly available records. To have your information removed, we recommend requesting removal directly through your county’s website.
Purchase Details
Purchase Details
Purchase Details
Purchase Details
Home Values in the Area
Average Home Value in this Area
Purchase History
We collect this data history from publicly available records. To have your information removed, we recommend requesting removal directly through your county’s website.
| Date | Buyer | Sale Price | Title Company |
|---|---|---|---|
| $2,600,000 | None Available | ||
| -- | -- | ||
| $440,000 | -- | ||
| -- | -- |
Tax History
We collect this data history from publicly available records. To have your information removed, we recommend requesting removal directly through your county’s website.
| Year | Tax Paid | Tax Assessment Tax Assessment Total Assessment is a certain percentage of the fair market value that is determined by local assessors to be the total taxable value of land and additions on the property. | Land | Improvement |
|---|---|---|---|---|
| 2025 | $6,949 | $562,700 | $549,000 | $13,700 |
| 2024 | $7,225 | $562,700 | $549,000 | $13,700 |
| 2023 | $7,182 | $532,400 | $518,700 | $13,700 |
| 2022 | $12,038 | $789,400 | $467,800 | $321,600 |
| 2021 | $12,267 | $751,200 | $444,700 | $306,500 |
| 2020 | $12,663 | $776,400 | $444,700 | $331,700 |
| 2019 | $11,789 | $718,400 | $444,700 | $273,700 |
| 2018 | $11,700 | $718,700 | $444,700 | $274,000 |
| 2017 | $10,386 | $628,700 | $439,100 | $189,600 |
| 2016 | $10,382 | $615,800 | $417,500 | $198,300 |
| 2015 | $9,532 | $590,200 | $437,100 | $153,100 |
Map
- 755 Main St
- 36 Stone Meadow Ln
- 11 Jutila Farm Path
- 85 Maple Ave
- 40 Longwater Dr
- 46 Tower Hill Dr
- 212 Spruce Way
- 114 Longwater Dr
- 10 James Rd
- 286 Mayflower Cir
- 6 Lydon Ln Unit C1
- 25 Buffum Rd
- 36 Monroe Rd
- 20 Jackson Rd
- 178 Main St
- 14 Sugar Maple Cir Unit 14
- 17 Hammer Hook Dr
- 70 Holly Berry Ln
- 28 Lantern Ln
- 799 Hanover St
Ask me questions while you tour the home.