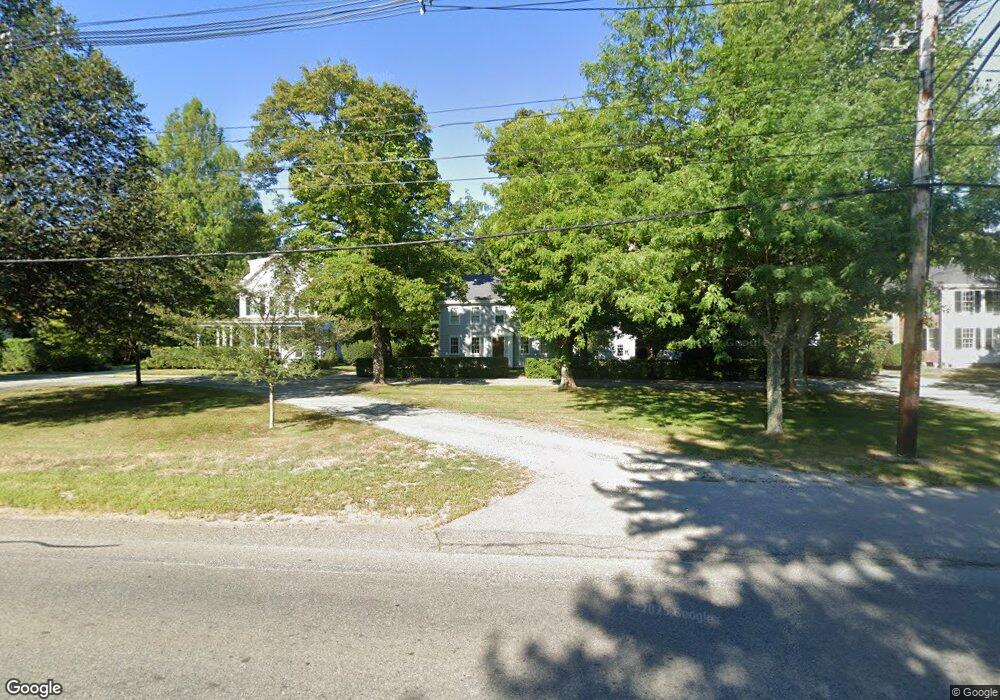
733 Main St Hingham, MA 02043
Estimated Value: $1,389,000 - $1,881,000
4
Beds
2
Baths
2,833
Sq Ft
$580/Sq Ft
Est. Value
About This Home
This home is located at 733 Main St, Hingham, MA 02043 and is currently estimated at $1,644,034, approximately $580 per square foot. 733 Main St is a home located in Plymouth County with nearby schools including South Elementary School, Hingham Middle School, and Hingham High School.
Ownership History
Date
Name
Owned For
Owner Type
Purchase Details
Closed on
May 7, 2024
Sold by
Mellors Elizabeth L
Bought by
733 Main St Ret and Mellors
Current Estimated Value
Purchase Details
Closed on
Mar 16, 2005
Sold by
Mellors Robert C and Mellors Elizabeth L
Bought by
Mellors Elizabeth L
Purchase Details
Closed on
Dec 28, 1991
Sold by
First Nationwide Bank
Bought by
Mellors Robt C and Mellors Eliz L
Purchase Details
Closed on
Nov 29, 1991
Sold by
Subryan Edward P
Bought by
First Nationwide Bk
Create a Home Valuation Report for This Property
The Home Valuation Report is an in-depth analysis detailing your home's value as well as a comparison with similar homes in the area
Purchase History
| Date | Buyer | Sale Price | Title Company |
|---|---|---|---|
| 733 Main St Ret | -- | None Available | |
| 733 Main St Ret | -- | None Available | |
| Mellors Elizabeth L | -- | -- | |
| Mellors Elizabeth L | -- | -- | |
| Mellors Robt C | $295,000 | -- | |
| First Nationwide Bk | $278,000 | -- |
Source: Public Records
Mortgage History
| Date | Status | Borrower | Loan Amount |
|---|---|---|---|
| Previous Owner | First Nationwide Bk | $100,000 | |
| Previous Owner | First Nationwide Bk | $148,000 |
Source: Public Records
Tax History
| Year | Tax Paid | Tax Assessment Tax Assessment Total Assessment is a certain percentage of the fair market value that is determined by local assessors to be the total taxable value of land and additions on the property. | Land | Improvement |
|---|---|---|---|---|
| 2025 | $14,083 | $1,317,400 | $670,500 | $646,900 |
| 2024 | $12,864 | $1,185,600 | $670,500 | $515,100 |
| 2023 | $11,617 | $1,161,700 | $670,500 | $491,200 |
| 2022 | $12,220 | $1,057,100 | $578,000 | $479,100 |
| 2021 | $11,802 | $1,000,200 | $578,000 | $422,200 |
| 2020 | $11,506 | $997,900 | $578,000 | $419,900 |
| 2019 | $11,469 | $971,100 | $578,000 | $393,100 |
| 2018 | $11,254 | $956,200 | $578,000 | $378,200 |
| 2017 | $10,868 | $887,200 | $560,300 | $326,900 |
| 2016 | $10,679 | $855,000 | $533,600 | $321,400 |
| 2015 | $10,435 | $832,800 | $525,200 | $307,600 |
Source: Public Records
Map
Nearby Homes
- 32-70 Lazell St
- 21 S Bradford Rd
- 70 Lazell St
- 32 Lazell St
- 2 Black Rock Dr Unit 21
- 2 Black Rock Dr
- 5 Old County Rd
- 10 Colby Rd
- 249 High St
- 22 Linscott Rd
- 9 Mast Hill Rd
- 168 Stayner Dr Unit 168
- 1 Kerri Ln
- 6 Brewer Way
- 4 Kerri Ln
- 4 Richard Rd
- 86 Black Rock Dr
- 1 Gardner Terrace
- 183 Gardner St
- 10 Popes Ln