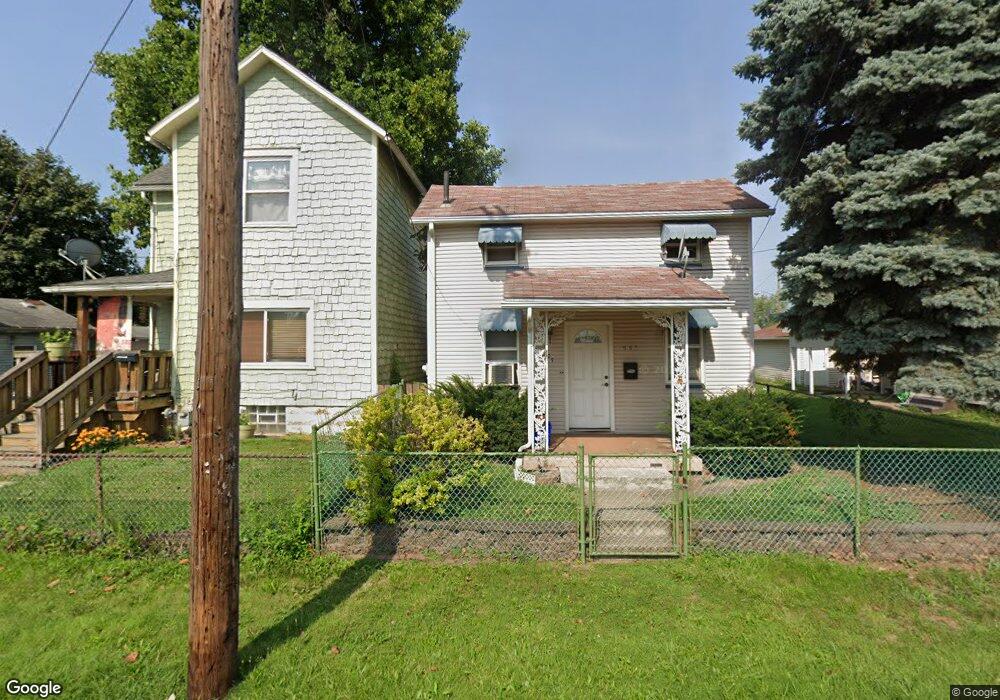
733 Marion Ave SW Canton, OH 44707
Southwest Association of Neighbors NeighborhoodEstimated Value: $53,000 - $85,000
2
Beds
1
Bath
1,036
Sq Ft
$68/Sq Ft
Est. Value
About This Home
This home is located at 733 Marion Ave SW, Canton, OH 44707 and is currently estimated at $70,675, approximately $68 per square foot. 733 Marion Ave SW is a home located in Stark County with nearby schools including Early Learning Center @ Schreiber, Cedar Elementary School, and Clarendon Intermediate School.
Ownership History
Date
Name
Owned For
Owner Type
Purchase Details
Closed on
Nov 8, 2017
Sold by
Scott Richard W and Scott Melissa L
Bought by
Stewart Justin M and Stewart Michelle L
Current Estimated Value
Purchase Details
Closed on
Jan 11, 2016
Sold by
Scott Richard W and Scott Melissa
Bought by
Stewart Justin M and Stewart Michelle L
Home Financials for this Owner
Home Financials are based on the most recent Mortgage that was taken out on this home.
Original Mortgage
$15,000
Interest Rate
3.92%
Mortgage Type
Seller Take Back
Purchase Details
Closed on
Sep 8, 2008
Sold by
Scott Robert W
Bought by
Scott Richard W and Scott Mellisa L
Purchase Details
Closed on
May 7, 1996
Sold by
Scott Randy
Bought by
Scott Robert W
Purchase Details
Closed on
Feb 26, 1993
Purchase Details
Closed on
Mar 20, 1992
Create a Home Valuation Report for This Property
The Home Valuation Report is an in-depth analysis detailing your home's value as well as a comparison with similar homes in the area
Home Values in the Area
Average Home Value in this Area
Purchase History
| Date | Buyer | Sale Price | Title Company |
|---|---|---|---|
| Stewart Justin M | $20,000 | None Available | |
| Stewart Justin M | $20,000 | Attorney | |
| Scott Richard W | -- | None Available | |
| Scott Robert W | $4,000 | -- | |
| -- | $5,000 | -- | |
| -- | -- | -- |
Source: Public Records
Mortgage History
| Date | Status | Borrower | Loan Amount |
|---|---|---|---|
| Previous Owner | Stewart Justin M | $15,000 |
Source: Public Records
Tax History Compared to Growth
Tax History
| Year | Tax Paid | Tax Assessment Tax Assessment Total Assessment is a certain percentage of the fair market value that is determined by local assessors to be the total taxable value of land and additions on the property. | Land | Improvement |
|---|---|---|---|---|
| 2025 | -- | $15,410 | $1,580 | $13,830 |
| 2024 | -- | $15,410 | $1,580 | $13,830 |
| 2023 | $458 | $7,490 | $980 | $6,510 |
| 2022 | $449 | $7,490 | $980 | $6,510 |
| 2021 | $454 | $7,490 | $980 | $6,510 |
| 2020 | $403 | $5,950 | $840 | $5,110 |
| 2019 | $354 | $5,950 | $840 | $5,110 |
| 2018 | $356 | $5,950 | $840 | $5,110 |
| 2017 | $330 | $5,010 | $770 | $4,240 |
| 2016 | $331 | $5,010 | $770 | $4,240 |
| 2015 | $340 | $5,120 | $770 | $4,350 |
| 2014 | $352 | $4,980 | $770 | $4,210 |
| 2013 | $167 | $4,980 | $770 | $4,210 |
Source: Public Records
Map
Nearby Homes
- 1016 Clinton Ave SW
- 1017 Clinton Ave SW
- 1024 3rd St NW
- 719 Prospect Ave SW
- 817 Prospect Ave SW
- 1015 4th St NW
- 413 Newton Ave NW
- 1033 Monnot Place NW
- 646 Dueber Ave SW
- 1334 Margaret Ave SW
- 916 6th St NW
- 1356 Margaret Ave SW
- 633 Park Ave SW
- 1215 Dueber Ave SW
- 1219 Dueber Ave SW
- 202 Lincoln Ave NW
- 631 Greenfield Ave SW
- 722 High Ave NW
- 1021 Greenfield Ave SW
- 435 Hazlett Ave NW
- 729 Marion Ave SW
- 723 Marion Ave SW
- 735 Marion Ave SW
- 724 Marion Ave SW
- 900 Raynolds Place SW
- 734 Marion Ave SW
- 720 Marion Ave SW
- 745 Marion Ave SW
- 904 Saylor Place SW
- 907 Saylor Place SW
- 713 Marion Ave SW
- 908 Raynolds Place SW
- 717 Saylor Place SW
- 723 Raynolds Place SW
- 901 Raynolds Place SW
- 905 8th St SW
- 720 Raynolds Place SW
- 714 Marion Ave SW
- 724 Union Ave SW
- 746 Marion Ave SW