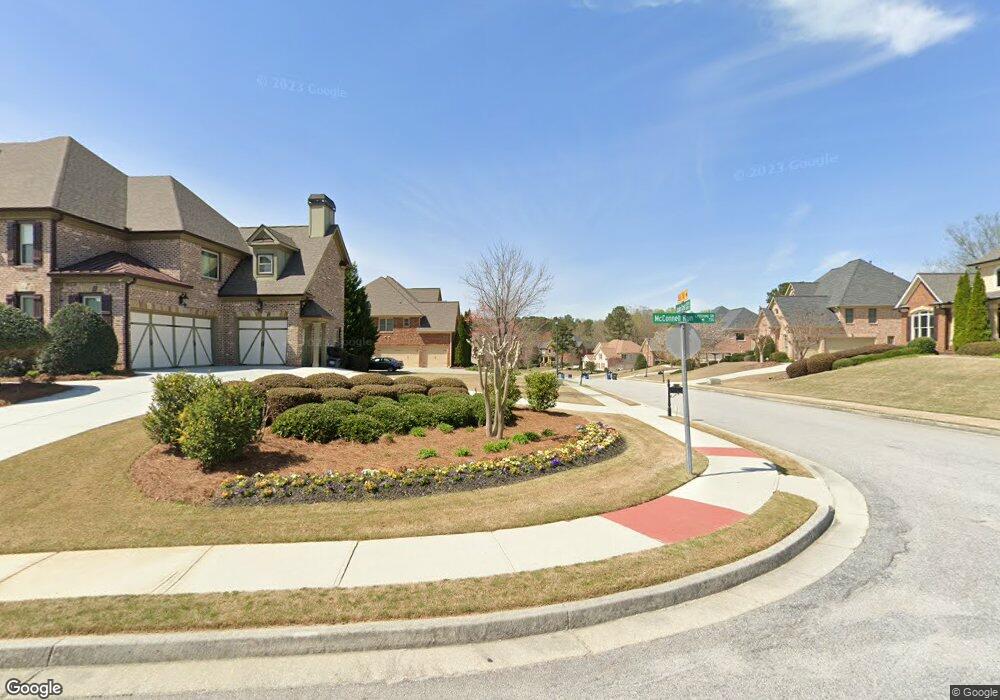
733 McConnell Run Crossing Grayson, GA 30017
Estimated Value: $799,340 - $1,032,000
6
Beds
7
Baths
3,848
Sq Ft
$232/Sq Ft
Est. Value
About This Home
This home is located at 733 McConnell Run Crossing, Grayson, GA 30017 and is currently estimated at $892,335, approximately $231 per square foot. 733 McConnell Run Crossing is a home located in Gwinnett County with nearby schools including Grayson Elementary School, Bay Creek Middle School, and Grayson High School.
Ownership History
Date
Name
Owned For
Owner Type
Purchase Details
Closed on
Jul 30, 2014
Sold by
Regions Bank
Bought by
Harris Stefan and Odom-Harris June
Current Estimated Value
Home Financials for this Owner
Home Financials are based on the most recent Mortgage that was taken out on this home.
Original Mortgage
$408,035
Outstanding Balance
$309,892
Interest Rate
4.16%
Mortgage Type
VA
Estimated Equity
$582,443
Purchase Details
Closed on
Sep 3, 2013
Sold by
Thompson Roy M
Bought by
Regions Bank
Purchase Details
Closed on
Jul 26, 2007
Sold by
Creekstone Builders Llc
Bought by
Thompson Roy M and Thompson Ovril S
Home Financials for this Owner
Home Financials are based on the most recent Mortgage that was taken out on this home.
Original Mortgage
$462,800
Interest Rate
5.88%
Mortgage Type
New Conventional
Purchase Details
Closed on
Jul 28, 2005
Sold by
Grayson-Rosebud Partners Llc
Bought by
Mill Creek Homes Ii Llc
Create a Home Valuation Report for This Property
The Home Valuation Report is an in-depth analysis detailing your home's value as well as a comparison with similar homes in the area
Home Values in the Area
Average Home Value in this Area
Purchase History
| Date | Buyer | Sale Price | Title Company |
|---|---|---|---|
| Harris Stefan | $395,000 | -- | |
| Regions Bank | -- | -- | |
| Thompson Roy M | $578,500 | -- | |
| Mill Creek Homes Ii Llc | $160,000 | -- | |
| Creekstone Builders Llc | $85,000 | -- |
Source: Public Records
Mortgage History
| Date | Status | Borrower | Loan Amount |
|---|---|---|---|
| Open | Harris Stefan | $408,035 | |
| Previous Owner | Thompson Roy M | $462,800 | |
| Previous Owner | Thompson Roy M | $115,700 |
Source: Public Records
Tax History Compared to Growth
Tax History
| Year | Tax Paid | Tax Assessment Tax Assessment Total Assessment is a certain percentage of the fair market value that is determined by local assessors to be the total taxable value of land and additions on the property. | Land | Improvement |
|---|---|---|---|---|
| 2025 | $5,664 | $350,120 | $44,120 | $306,000 |
| 2024 | $5,975 | $353,040 | $44,120 | $308,920 |
| 2023 | $5,975 | $306,200 | $55,200 | $251,000 |
| 2022 | $5,128 | $287,680 | $46,400 | $241,280 |
| 2021 | $6,721 | $196,040 | $36,000 | $160,040 |
| 2020 | $6,624 | $189,400 | $36,000 | $153,400 |
| 2019 | $6,408 | $189,400 | $36,000 | $153,400 |
| 2018 | $6,106 | $176,480 | $28,000 | $148,480 |
| 2016 | $6,095 | $175,080 | $28,000 | $147,080 |
| 2015 | $5,777 | $158,000 | $28,000 | $130,000 |
| 2014 | $5,368 | $158,520 | $28,000 | $130,520 |
Source: Public Records
Map
Nearby Homes
- 627 Heritage Post Ln
- 2382 Alexander Top Place
- 2740 Heritage Bend Ct
- 692 Heritage Post Ln
- 2609 Jacobs Crest Cove
- 2326 Britt St
- 737 Heritage Post Ln
- 760 Windsor Place Cir
- 725 Windsor Place Cir SW
- 2160 Railyard Ave
- 2120 Railyard Ave Unit 13
- 480 Brown Dove Ln
- 2379 Brown Dove Way
- 2199 Britt St
- 2160 Rail Yard Ave
- 622 Madison Park Dr
- 2645 Mourning Dove Dr
- 559 Madison Park Dr
- 612 Chestnut Walk Place Unit 1
- 632 Chestnut Walk Place
- 339 Rays Ct Unit 13
- 328 Ray's Ct Unit 8
- 379 Rays Ct Unit 17
- 359 Rays Ct Unit 15
- 308 Rays Ct Unit 10
- 358 Rays Ct Unit 5
- 368 Rays Ct Unit 4
- 378 Rays Ct Unit 3
- 388 Rays Ct Unit 2
- 602 Chestnut Walk Place
- 615 Chestnut Walk Place
- 592 Chestnut Walk Place
- 0 Chestnut Walk Place SW Unit 8360116
- 0 Chestnut Walk Place SW Unit 8256758
- 0 Chestnut Walk Place SW Unit 7582045
- 0 Chestnut Walk Place SW Unit 7321179
- 0 Chestnut Walk Place SW Unit 7059181
- 0 Chestnut Walk Place SW Unit 8609496