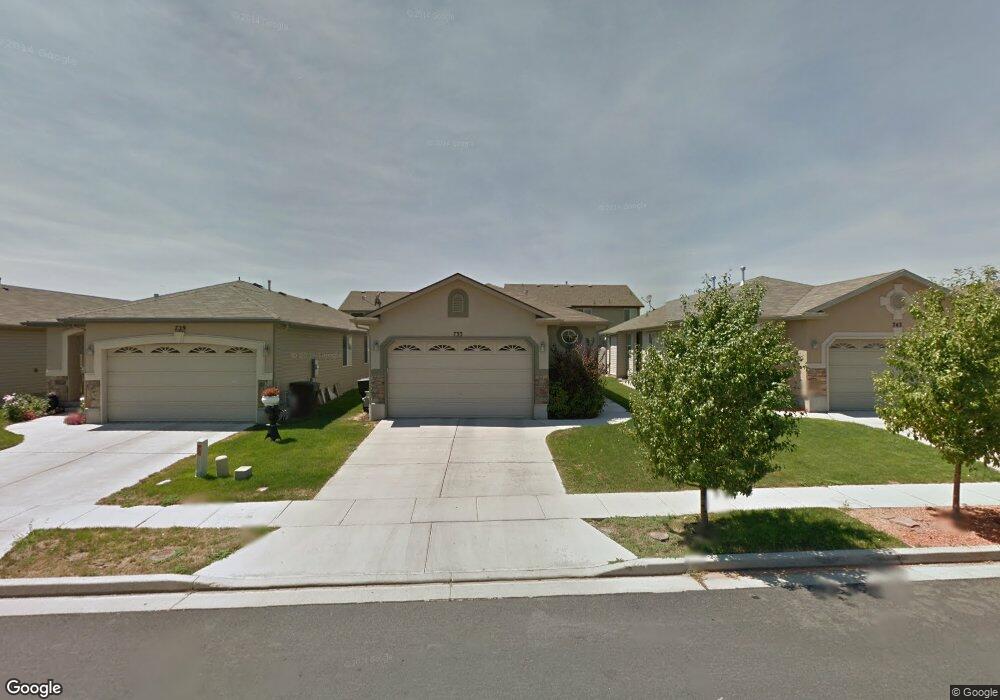
733 N Bradford Dr North Salt Lake, UT 84054
Estimated Value: $422,000 - $450,391
3
Beds
2
Baths
1,114
Sq Ft
$393/Sq Ft
Est. Value
About This Home
This home is located at 733 N Bradford Dr, North Salt Lake, UT 84054 and is currently estimated at $438,348, approximately $393 per square foot. 733 N Bradford Dr is a home located in Davis County with nearby schools including Foxboro School, Mueller Park Junior High School, and Bountiful High School.
Ownership History
Date
Name
Owned For
Owner Type
Purchase Details
Closed on
Jun 28, 2021
Sold by
Christopherson David
Bought by
Adoora Llc
Current Estimated Value
Purchase Details
Closed on
Jun 23, 2021
Sold by
Adoora Llc
Bought by
Christopherson David
Purchase Details
Closed on
Nov 17, 2011
Sold by
Kisana Shawn and Kisana Halley
Bought by
Peay Matthew W and Peay Hayley A
Home Financials for this Owner
Home Financials are based on the most recent Mortgage that was taken out on this home.
Original Mortgage
$152,044
Interest Rate
3.75%
Mortgage Type
FHA
Purchase Details
Closed on
Jan 10, 2006
Sold by
Foxboro Villages Llc
Bought by
Kisana Shawn and Kisana Hailey
Home Financials for this Owner
Home Financials are based on the most recent Mortgage that was taken out on this home.
Original Mortgage
$155,684
Interest Rate
6.28%
Mortgage Type
FHA
Purchase Details
Closed on
Oct 14, 2005
Sold by
Portola Development Utah Lc
Bought by
Foxboro Villages Llc
Create a Home Valuation Report for This Property
The Home Valuation Report is an in-depth analysis detailing your home's value as well as a comparison with similar homes in the area
Home Values in the Area
Average Home Value in this Area
Purchase History
| Date | Buyer | Sale Price | Title Company |
|---|---|---|---|
| Adoora Llc | -- | North American Title | |
| Christopherson David | -- | North American Tit | |
| Peay Matthew W | -- | Gateway Title Ins Ag | |
| Kisana Shawn | -- | Us Title Company Of Utah | |
| Foxboro Villages Llc | -- | Us Title Company Of Utah |
Source: Public Records
Mortgage History
| Date | Status | Borrower | Loan Amount |
|---|---|---|---|
| Previous Owner | Peay Matthew W | $152,044 | |
| Previous Owner | Kisana Shawn | $155,684 |
Source: Public Records
Tax History Compared to Growth
Tax History
| Year | Tax Paid | Tax Assessment Tax Assessment Total Assessment is a certain percentage of the fair market value that is determined by local assessors to be the total taxable value of land and additions on the property. | Land | Improvement |
|---|---|---|---|---|
| 2025 | $2,154 | $218,900 | $89,934 | $128,966 |
| 2024 | $2,154 | $216,699 | $92,025 | $124,674 |
| 2023 | $2,024 | $202,400 | $65,271 | $137,128 |
| 2022 | $2,204 | $400,000 | $94,129 | $305,871 |
| 2021 | $1,994 | $302,000 | $72,709 | $229,291 |
| 2020 | $1,762 | $264,000 | $62,127 | $201,873 |
| 2019 | $1,800 | $263,000 | $55,543 | $207,457 |
| 2018 | $1,626 | $235,000 | $50,494 | $184,506 |
| 2016 | $1,369 | $105,270 | $27,772 | $77,498 |
| 2015 | $1,288 | $95,095 | $27,772 | $67,323 |
| 2014 | $1,354 | $101,904 | $27,772 | $74,132 |
| 2013 | -- | $88,536 | $29,712 | $58,824 |
Source: Public Records
Map
Nearby Homes
- 715 Leeds Ct
- 741 N Skipton Dr
- 1127 W Haworth Dr
- 1072 W Stonehaven Dr
- 114 Birmingham Ln
- 1002 W Stonehaven Dr Unit 108
- 452 N Kent Ln
- 448 Kent Dr
- 433 Kent Dr
- 940 W Stonehaven Dr
- 997 N Fox Hollow Dr
- 273 Birmingham Ln
- 920 W Stonehaven Dr
- 1052 Chidester Dr
- 1147 Ethnie Ct
- 954 N Picadilly Ct
- 928 Amberly Dr
- 967 Amberly Dr
- 979 Amberly Dr
- 875 Walton Dr
- 733 N Bradford Dr
- 729 N Bradford Dr
- 729 N Bradford Dr
- 744 Bradford
- 740 Bradford
- 721 N Bradford Dr
- 721 N Bradford Dr
- 747 N Bradford Dr
- 738 Leeds Ct
- 730 Leeds Ct
- 717 N Bradford Dr
- 717 N Bradford Dr
- 757 N Bradford Dr
- 724 Leeds Ct
- 757 N Bradford Dr
- 747 Bradford
- 743 Bradford
- 740 N Bradford Dr
- 730 N Bradford Dr
- 720 Leeds Ct