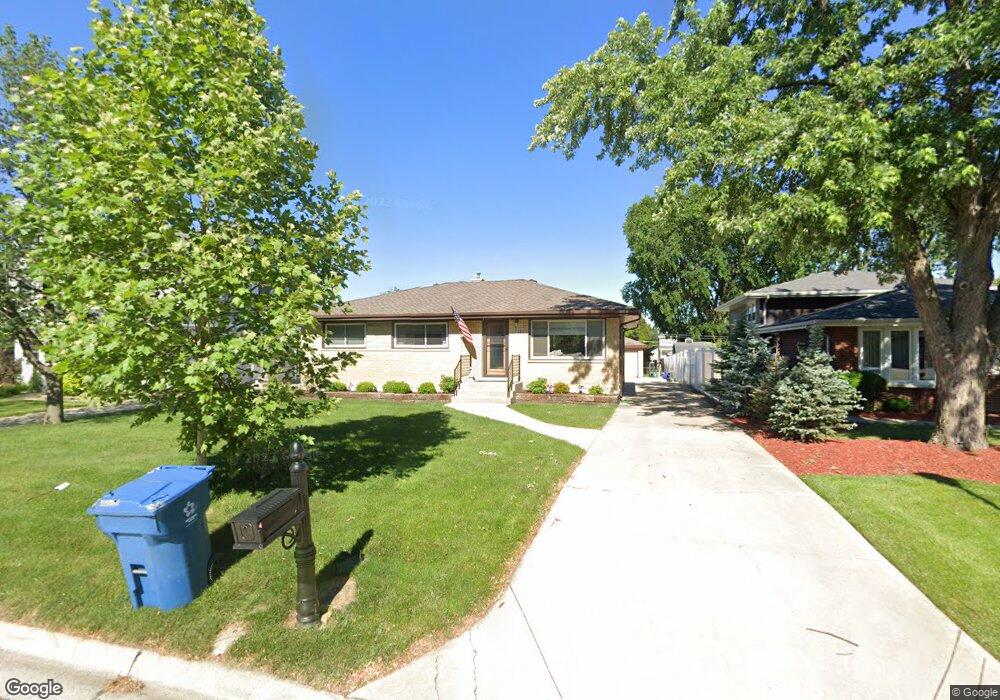
733 N Howard Ave Elmhurst, IL 60126
Estimated Value: $343,630 - $454,000
Studio
--
Bath
1,120
Sq Ft
$353/Sq Ft
Est. Value
About This Home
This home is located at 733 N Howard Ave, Elmhurst, IL 60126 and is currently estimated at $395,408, approximately $353 per square foot. 733 N Howard Ave is a home located in DuPage County with nearby schools including Conrad Fischer Elementary School, Churchville Middle School, and York Community High School.
Ownership History
Date
Name
Owned For
Owner Type
Purchase Details
Closed on
Dec 13, 2011
Sold by
Kweller Andrew J and Bac Home Loans Servicing Lp
Bought by
Federal Home Loan Mortgage Corporation
Current Estimated Value
Create a Home Valuation Report for This Property
The Home Valuation Report is an in-depth analysis detailing your home's value as well as a comparison with similar homes in the area
Home Values in the Area
Average Home Value in this Area
Purchase History
| Date | Buyer | Sale Price | Title Company |
|---|---|---|---|
| Federal Home Loan Mortgage Corporation | -- | None Available |
Source: Public Records
Tax History
| Year | Tax Paid | Tax Assessment Tax Assessment Total Assessment is a certain percentage of the fair market value that is determined by local assessors to be the total taxable value of land and additions on the property. | Land | Improvement |
|---|---|---|---|---|
| 2024 | $6,066 | $115,056 | $52,671 | $62,385 |
| 2023 | $5,540 | $105,770 | $48,420 | $57,350 |
| 2022 | $5,440 | $99,800 | $46,330 | $53,470 |
| 2021 | $5,189 | $95,600 | $44,380 | $51,220 |
| 2020 | $4,864 | $91,570 | $42,510 | $49,060 |
| 2019 | $4,796 | $88,040 | $40,870 | $47,170 |
| 2018 | $4,162 | $77,450 | $38,920 | $38,530 |
| 2017 | $4,059 | $74,020 | $37,200 | $36,820 |
| 2016 | $3,849 | $68,340 | $34,350 | $33,990 |
| 2015 | $3,731 | $63,130 | $31,730 | $31,400 |
| 2014 | $4,295 | $61,160 | $30,800 | $30,360 |
| 2013 | $4,280 | $62,410 | $31,430 | $30,980 |
Source: Public Records
Map
Nearby Homes
- 786 N Van Auken St
- 711 N Kenilworth Ave
- 758 N Kenilworth Ave
- 15W425 Victory Pkwy
- 738 N Parker St
- 3N264 N Howard Ave
- 841 N York St Unit 202
- 841 N York St Unit 109
- 841 N York St Unit 218
- 132 E Gladys Ave
- 516 N Emroy Ave
- 909 N Addison Ave
- 3N550 Crown Rd Unit 1
- 3N550 Crown Rd Unit 14
- 483 N Larch Ave Unit 204W
- 139 E Grand Ave Unit 1B
- 183 E Grantley Ave
- 234 E Grantley Ave
- 557 N Myrtle Ave
- 26 King Arthur Ct Unit 4
- 739 N Howard Ave
- 727 N Howard Ave
- 264 E Fullerton Ave
- 723 N Howard Ave
- 740 N Emroy Ave
- 744 N Emroy Ave
- 734 N Emroy Ave
- 730 N Emroy Ave
- 721 N Howard Ave
- 750 N Emroy Ave
- 734 N Howard Ave
- 740 N Howard Ave
- 730 N Howard Ave
- 252 E Fullerton Ave
- 726 N Emroy Ave
- 715 N Howard Ave
- 726 N Howard Ave
- 267 E Fullerton Ave
- 720 N Howard Ave
- 281 E Fullerton Ave
Your Personal Tour Guide
Ask me questions while you tour the home.