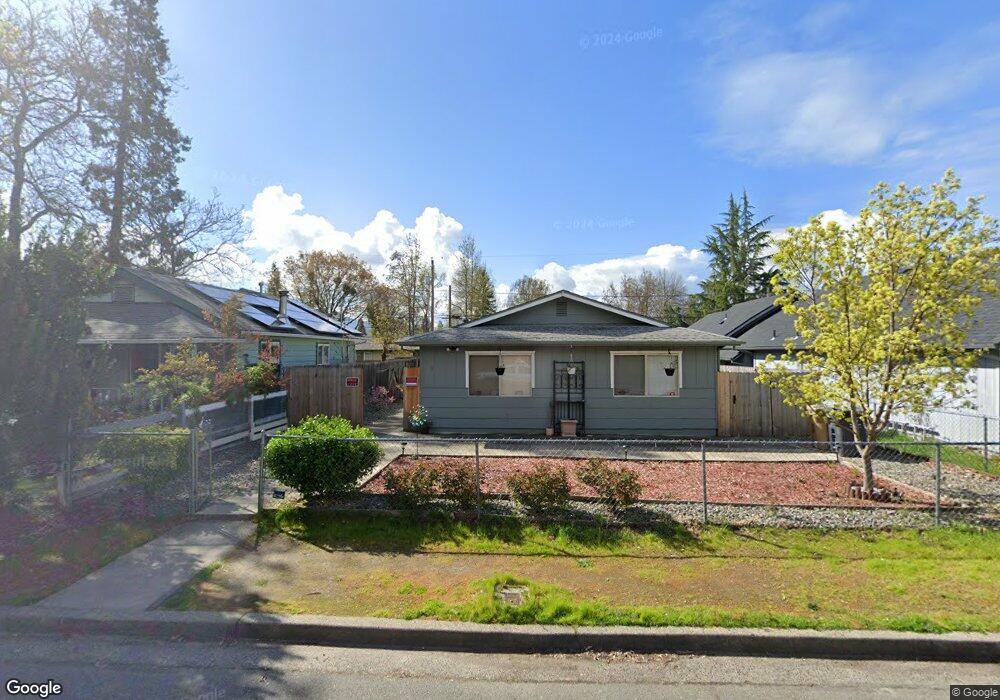
733 SW H St Unit 735 Grants Pass, OR 97526
Estimated Value: $339,167 - $369,000
4
Beds
2
Baths
1,620
Sq Ft
$219/Sq Ft
Est. Value
About This Home
This home is located at 733 SW H St Unit 735, Grants Pass, OR 97526 and is currently estimated at $354,084, approximately $218 per square foot. 733 SW H St Unit 735 is a home located in Josephine County with nearby schools including Parkside Elementary School, North Middle School, and Grants Pass High School.
Ownership History
Date
Name
Owned For
Owner Type
Purchase Details
Closed on
Jul 9, 2025
Sold by
Araiza Jonathan and Araiza Luisa Jessica
Bought by
Steadyhome Llc
Current Estimated Value
Purchase Details
Closed on
Jun 11, 2025
Sold by
Araiza Jonathan
Bought by
Evermore Family Trust and Araiza
Purchase Details
Closed on
Feb 11, 2025
Sold by
Araiza Jonathan
Bought by
Araiza Jonathan and Araiza Luisa Jessica
Purchase Details
Closed on
May 27, 2021
Sold by
Dong Mi and Zhao Si Hong
Bought by
Araiza Jonathan
Home Financials for this Owner
Home Financials are based on the most recent Mortgage that was taken out on this home.
Original Mortgage
$306,776
Interest Rate
3%
Mortgage Type
FHA
Purchase Details
Closed on
Oct 7, 2015
Sold by
Czaiko Patricia N and Holland Patricia M
Bought by
Dong Mi and Zhao Si Hong
Create a Home Valuation Report for This Property
The Home Valuation Report is an in-depth analysis detailing your home's value as well as a comparison with similar homes in the area
Home Values in the Area
Average Home Value in this Area
Purchase History
| Date | Buyer | Sale Price | Title Company |
|---|---|---|---|
| Steadyhome Llc | -- | None Listed On Document | |
| Evermore Family Trust | -- | None Listed On Document | |
| Araiza Jonathan | -- | None Listed On Document | |
| Araiza Jonathan | $335,000 | Amerititle | |
| Dong Mi | $145,000 | First American |
Source: Public Records
Mortgage History
| Date | Status | Borrower | Loan Amount |
|---|---|---|---|
| Previous Owner | Araiza Jonathan | $306,776 |
Source: Public Records
Tax History Compared to Growth
Tax History
| Year | Tax Paid | Tax Assessment Tax Assessment Total Assessment is a certain percentage of the fair market value that is determined by local assessors to be the total taxable value of land and additions on the property. | Land | Improvement |
|---|---|---|---|---|
| 2025 | $2,183 | $168,090 | -- | -- |
| 2024 | $2,183 | $163,200 | -- | -- |
| 2023 | $2,056 | $158,450 | $0 | $0 |
| 2022 | $2,004 | $153,840 | $0 | $0 |
| 2021 | $1,940 | $149,360 | $0 | $0 |
| 2020 | $1,884 | $145,010 | $0 | $0 |
| 2019 | $1,830 | $140,790 | $0 | $0 |
| 2018 | $1,862 | $136,690 | $0 | $0 |
| 2017 | $1,848 | $132,710 | $0 | $0 |
| 2016 | $1,619 | $128,850 | $0 | $0 |
| 2015 | $1,572 | $125,100 | $0 | $0 |
| 2014 | $1,528 | $121,460 | $0 | $0 |
Source: Public Records
Map
Nearby Homes
- 207 SW Oak St
- 1011 SW I St
- 205 SW Booth St
- 1019 SW J St
- 927 SW L St
- 1013 SW L St
- 330 SW K St
- 708 SW Bridge St
- 303 SW I St
- 508 NW E St Unit A,B,C
- 405 NW Dimmick St
- 47 SW Eastern Ave Unit 8
- 53 SW Eastern Ave Unit 53, 55
- 416 NW Booth St
- 419 NW D St
- 139 SW I St
- 419 NW C St
- 1308 NW F St
- 1613 SW I St
- 11311133 SW Central Ave