Estimated Value: $368,000 - $405,000
About This Home
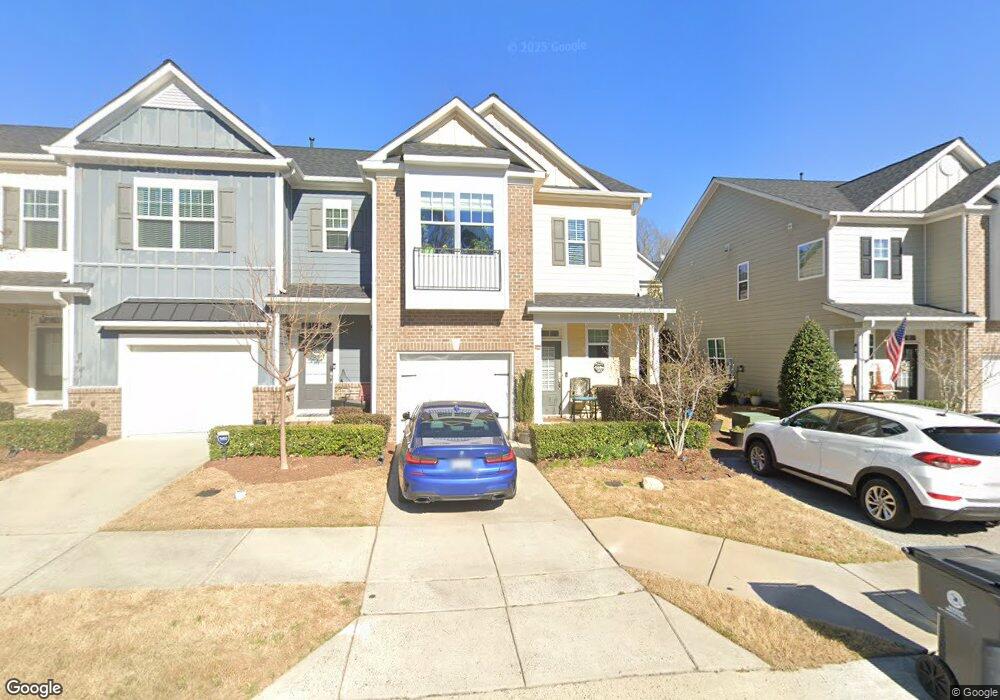
This home is located at 733 Treviso Ln, Apex, NC 27502 and is currently estimated at $382,336, approximately $213 per square foot. 733 Treviso Ln is a home located in Wake County with nearby schools including Apex Elementary School, Apex Middle, and Apex High School.
Ownership History
We collect this data history from publicly available records. To have your information removed, we recommend requesting removal directly through your county’s website.
Purchase Details
Home Financials for this Owner
Home Financials are based on the most recent Mortgage that was taken out on this home.Purchase Details
Home Financials for this Owner
Home Financials are based on the most recent Mortgage that was taken out on this home.Purchase History
We collect this data history from publicly available records. To have your information removed, we recommend requesting removal directly through your county’s website.
| Date | Buyer | Sale Price | Title Company |
|---|---|---|---|
| $225,000 | None Available | ||
| $195,000 | None Available |
Mortgage History
We collect this data history from publicly available records. To have your information removed, we recommend requesting removal directly through your county’s website.
| Date | Status | Borrower | Loan Amount |
|---|---|---|---|
| Open | $124,900 | ||
| Previous Owner | $155,452 |
Tax History
We collect this data history from publicly available records. To have your information removed, we recommend requesting removal directly through your county’s website.
| Year | Tax Paid | Tax Assessment Tax Assessment Total Assessment is a certain percentage of the fair market value that is determined by local assessors to be the total taxable value of land and additions on the property. | Land | Improvement |
|---|---|---|---|---|
| 2025 | $3,415 | $388,879 | $85,000 | $303,879 |
| 2024 | $3,339 | $388,879 | $85,000 | $303,879 |
| 2023 | $2,911 | $263,531 | $50,000 | $213,531 |
| 2022 | $2,733 | $263,531 | $50,000 | $213,531 |
| 2021 | $2,629 | $263,531 | $50,000 | $213,531 |
| 2020 | $2,603 | $263,531 | $50,000 | $213,531 |
| 2019 | $2,481 | $216,670 | $40,000 | $176,670 |
| 2018 | $2,337 | $216,670 | $40,000 | $176,670 |
| 2017 | $2,176 | $216,670 | $40,000 | $176,670 |
| 2016 | $2,144 | $216,670 | $40,000 | $176,670 |
| 2015 | $1,859 | $183,058 | $30,000 | $153,058 |
| 2014 | $1,792 | $183,058 | $30,000 | $153,058 |
Map
- 736 Treviso Ln
- 647 Briarcliff St
- 810 Bryn Mawr Ct
- 804 Olive St
- 708 Aladdin Cir
- 2367 Kettle Falls Station
- 105 Cunningham St
- 324 Old Grove Ln
- 108 N Mason St
- 325 Old Mill Village Dr
- 848 Myrtle Grove Ln
- 208 Log Pond Ct
- 712 Goldenview Acres Ct
- 311 Culvert St
- 103 Litton St
- 2296 Apex Peakway
- 206 E Williams St
- 2294 Apex Peakway
- 2292 Apex Peakway
- 309 Culvert St
- 737 Treviso Ln
- 739 Treviso Ln
- 741 Treviso Ln
- 731 Treviso Ln
- 743 Treviso Ln
- 729 Treviso Ln
- 628 Briarcliff St
- 745 Treviso Ln
- 626 Briarcliff St
- 624 Briarcliff St
- 727 Treviso Ln
- 620 Briarcliff St
- 725 Treviso Ln
- 738 Treviso Ln
- 740 Treviso Ln
- 742 Treviso Ln
- 618 Briarcliff St
- 732 Treviso Ln
- 744 Treviso Ln
- 801 Trendy Ln
Ask me questions while you tour the home.