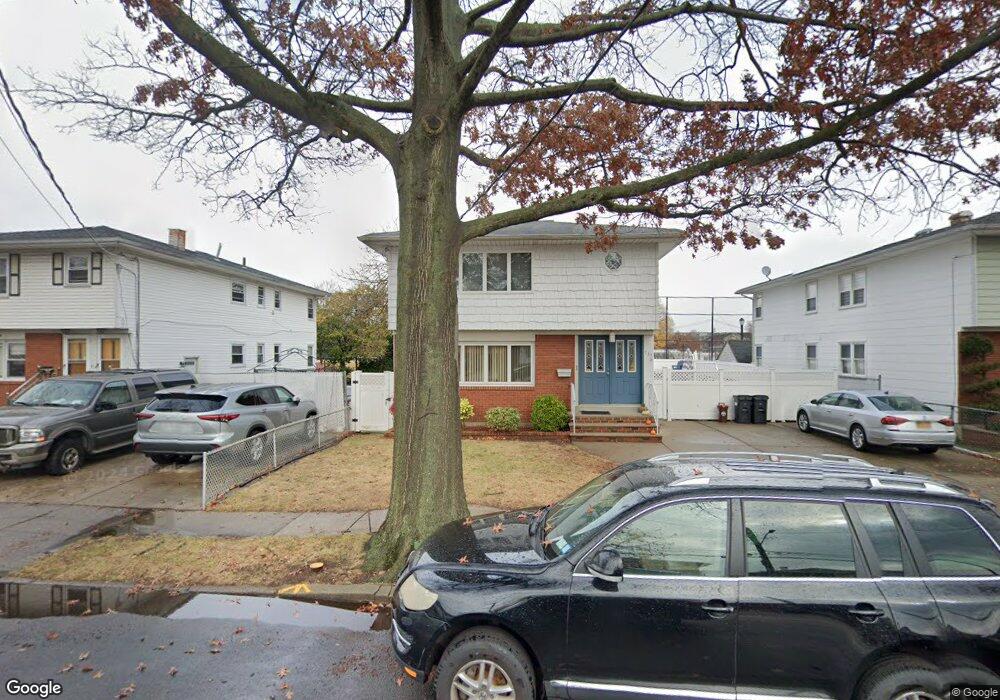
733 Tysens Ln Staten Island, NY 10306
Oakwood NeighborhoodEstimated Value: $873,163 - $1,062,000
--
Bed
--
Bath
2,150
Sq Ft
$460/Sq Ft
Est. Value
About This Home
This home is located at 733 Tysens Ln, Staten Island, NY 10306 and is currently estimated at $988,541, approximately $459 per square foot. 733 Tysens Ln is a home located in Richmond County with nearby schools including P.S. 50 Frank Hankinson School, Is 2 George L Egbert, and New Dorp High School.
Ownership History
Date
Name
Owned For
Owner Type
Purchase Details
Closed on
Oct 26, 2015
Sold by
Bini John J
Bought by
Bini John J and Bini Melinda
Current Estimated Value
Home Financials for this Owner
Home Financials are based on the most recent Mortgage that was taken out on this home.
Original Mortgage
$300,000
Interest Rate
3.87%
Mortgage Type
New Conventional
Purchase Details
Closed on
Jan 25, 2011
Sold by
Bini Carole and Bini John J
Bought by
Bini John J
Home Financials for this Owner
Home Financials are based on the most recent Mortgage that was taken out on this home.
Original Mortgage
$175,000
Interest Rate
4.83%
Mortgage Type
New Conventional
Create a Home Valuation Report for This Property
The Home Valuation Report is an in-depth analysis detailing your home's value as well as a comparison with similar homes in the area
Home Values in the Area
Average Home Value in this Area
Purchase History
| Date | Buyer | Sale Price | Title Company |
|---|---|---|---|
| Bini John J | -- | Equity Settlement Services | |
| Bini John J | -- | None Available |
Source: Public Records
Mortgage History
| Date | Status | Borrower | Loan Amount |
|---|---|---|---|
| Closed | Bini John J | $300,000 | |
| Closed | Bini John J | $175,000 |
Source: Public Records
Tax History Compared to Growth
Tax History
| Year | Tax Paid | Tax Assessment Tax Assessment Total Assessment is a certain percentage of the fair market value that is determined by local assessors to be the total taxable value of land and additions on the property. | Land | Improvement |
|---|---|---|---|---|
| 2025 | $7,312 | $59,820 | $7,741 | $52,079 |
| 2024 | $7,312 | $55,620 | $7,854 | $47,766 |
| 2023 | $6,975 | $34,344 | $7,059 | $27,285 |
| 2022 | $6,468 | $53,220 | $12,000 | $41,220 |
| 2021 | $6,819 | $47,280 | $12,000 | $35,280 |
| 2020 | $6,807 | $40,800 | $12,000 | $28,800 |
| 2019 | $6,346 | $44,280 | $12,000 | $32,280 |
| 2018 | $5,834 | $28,620 | $10,060 | $18,560 |
| 2017 | $5,504 | $27,000 | $12,000 | $15,000 |
| 2016 | $5,410 | $27,060 | $12,000 | $15,060 |
| 2015 | $5,481 | $28,560 | $10,020 | $18,540 |
| 2014 | $5,481 | $28,560 | $10,020 | $18,540 |
Source: Public Records
Map
Nearby Homes