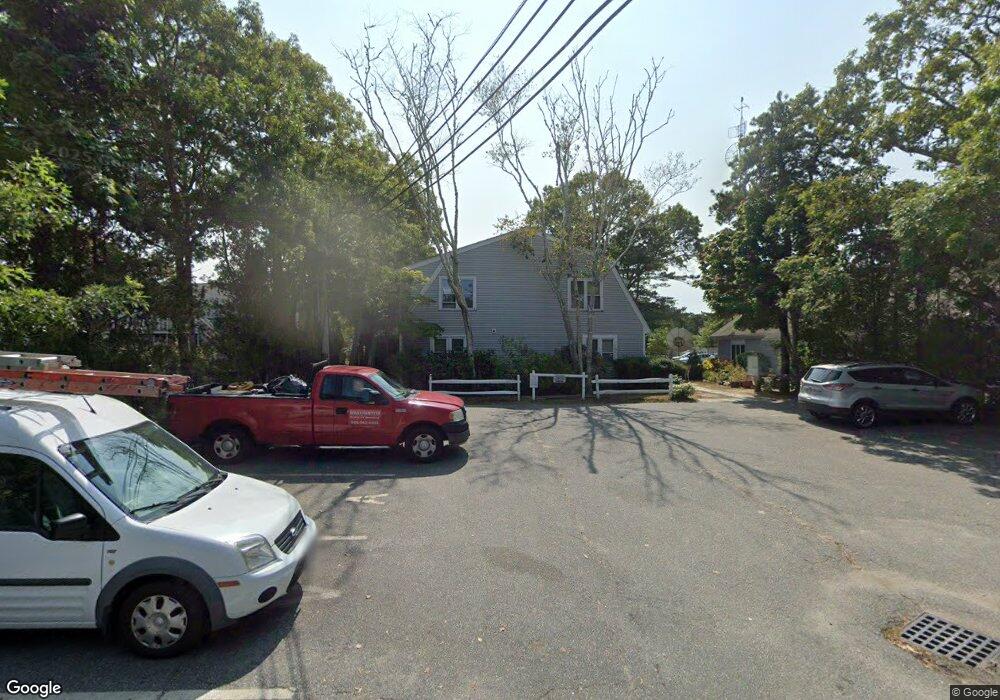
733 W Main St Unit H Hyannis, MA 02601
Estimated Value: $322,000 - $374,000
2
Beds
1
Bath
980
Sq Ft
$349/Sq Ft
Est. Value
About This Home
This home is located at 733 W Main St Unit H, Hyannis, MA 02601 and is currently estimated at $341,727, approximately $348 per square foot. 733 W Main St Unit H is a home located in Barnstable County with nearby schools including Hyannis West Elementary School, Barnstable United Elementary School, and Barnstable Intermediate School.
Ownership History
Date
Name
Owned For
Owner Type
Purchase Details
Closed on
Feb 13, 2009
Sold by
Lydian Private Bk
Bought by
Hovsepian Edward
Current Estimated Value
Purchase Details
Closed on
Oct 15, 2008
Sold by
Lydian Private Bk
Bought by
Lydian Private Bk
Purchase Details
Closed on
Jun 28, 2005
Sold by
Ashton John F and Ashton Valerie A
Bought by
Cimeno 3Rd Joseph
Home Financials for this Owner
Home Financials are based on the most recent Mortgage that was taken out on this home.
Original Mortgage
$160,000
Interest Rate
5.82%
Mortgage Type
Purchase Money Mortgage
Purchase Details
Closed on
Sep 30, 1998
Sold by
Heredia Julia
Bought by
Ashton John F and Ashton Valerie A
Home Financials for this Owner
Home Financials are based on the most recent Mortgage that was taken out on this home.
Original Mortgage
$55,300
Interest Rate
6.89%
Mortgage Type
Purchase Money Mortgage
Purchase Details
Closed on
Jul 17, 1995
Sold by
Johnson Robert A and Johnson Kathleen W
Bought by
Heredia Julia
Create a Home Valuation Report for This Property
The Home Valuation Report is an in-depth analysis detailing your home's value as well as a comparison with similar homes in the area
Home Values in the Area
Average Home Value in this Area
Purchase History
| Date | Buyer | Sale Price | Title Company |
|---|---|---|---|
| Hovsepian Edward | $76,000 | -- | |
| Lydian Private Bk | $130,000 | -- | |
| Cimeno 3Rd Joseph | $200,000 | -- | |
| Ashton John F | $61,500 | -- | |
| Heredia Julia | $41,500 | -- |
Source: Public Records
Mortgage History
| Date | Status | Borrower | Loan Amount |
|---|---|---|---|
| Previous Owner | Cimeno 3Rd Joseph | $160,000 | |
| Previous Owner | Cimeno 3Rd Joseph | $40,000 | |
| Previous Owner | Heredia Julia | $55,300 |
Source: Public Records
Tax History Compared to Growth
Tax History
| Year | Tax Paid | Tax Assessment Tax Assessment Total Assessment is a certain percentage of the fair market value that is determined by local assessors to be the total taxable value of land and additions on the property. | Land | Improvement |
|---|---|---|---|---|
| 2025 | $2,712 | $292,600 | $0 | $292,600 |
| 2024 | $2,477 | $273,700 | $0 | $273,700 |
| 2023 | $2,183 | $228,100 | $0 | $228,100 |
| 2022 | $1,811 | $156,500 | $0 | $156,500 |
| 2021 | $1,885 | $158,300 | $0 | $158,300 |
| 2020 | $1,999 | $162,100 | $0 | $162,100 |
| 2019 | $1,830 | $145,500 | $0 | $145,500 |
| 2018 | $1,551 | $126,100 | $0 | $126,100 |
| 2017 | $1,512 | $126,100 | $0 | $126,100 |
| 2016 | $1,479 | $126,100 | $0 | $126,100 |
| 2015 | $1,391 | $120,200 | $0 | $120,200 |
Source: Public Records
Map
Nearby Homes
- 825 W Main St Unit 4
- 855 W Main St Unit 7
- 576 Strawberry Hill Rd
- 68 Seaboard Ln
- 28 Peacock Dr
- 65 Olander Dr
- 75 Olander Dr
- 75 Olander Dr
- 83 Peacock Dr
- 7 Arbeta Rd
- 295 Sudbury Ln
- 21 Brian Ln
- 22 Keel Way
- 296 Lincoln Rd
- 270 Old Strawberry Hill Rd
- 386 Bishops Terrace
- 260 Tobey Way
- 36 Grouse Ln
- 140 Wequaquet Ln
- 290 Riverview Ln
- 733 W Main St Unit L
- 733 W Main St Unit K
- 733 W Main St Unit J
- 733 W Main St Unit I
- 733 W Main St Unit F
- 733 W Main St Unit E
- 733 W Main St Unit D
- 733 W Main St Unit C
- 733 W Main St Unit B
- 733 W Main St Unit A
- 733 W Main St Unit U-B
- 733 W Main St Unit K
- 733 W Main St Unit C BLDG 1
- 733 W Main St
- 725 W Main St
- 60 Pine St
- 70 Pine St Unit K
- 70 Pine St Unit I
- 70 Pine St Unit L
- 737 W Main St