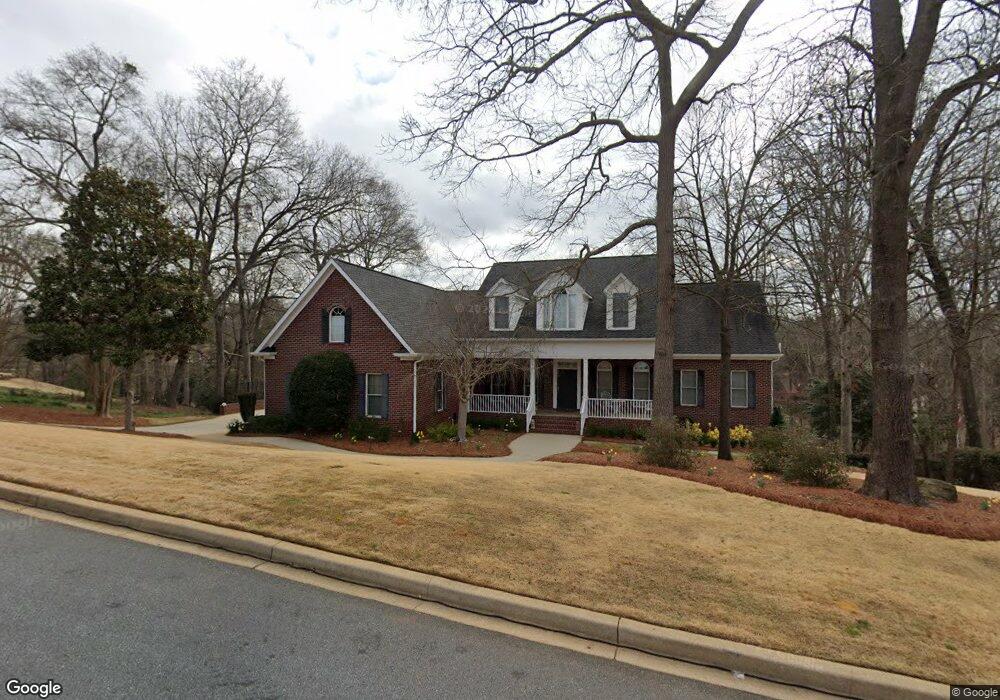
733 W Tara Ln Duncan, SC 29334
Estimated Value: $731,000 - $876,000
5
Beds
4
Baths
5,877
Sq Ft
$135/Sq Ft
Est. Value
About This Home
This home is located at 733 W Tara Ln, Duncan, SC 29334 and is currently estimated at $793,757, approximately $135 per square foot. 733 W Tara Ln is a home located in Spartanburg County with nearby schools including River Ridge Elementary School, Florence Chapel Middle School, and Berry Shoals Intermediate School.
Ownership History
Date
Name
Owned For
Owner Type
Purchase Details
Closed on
Jan 27, 2015
Sold by
Pauly Joan M and Pauly Frederick H
Bought by
Heiden John S and Heiden Deborah L
Current Estimated Value
Home Financials for this Owner
Home Financials are based on the most recent Mortgage that was taken out on this home.
Original Mortgage
$372,000
Outstanding Balance
$285,356
Interest Rate
3.88%
Mortgage Type
New Conventional
Estimated Equity
$508,401
Purchase Details
Closed on
Jan 19, 2012
Sold by
Pauly Joan M
Bought by
Pauly Joan M and Pauly Frederick H
Purchase Details
Closed on
Oct 22, 2007
Sold by
Pauly Frederick H and Pauly Joan M
Bought by
Pauly Frederick H and Pauly Joan M
Purchase Details
Closed on
May 6, 2002
Sold by
River Falls Plantation Golf Inc
Bought by
Pauly Frederick H and Pauly Joan M
Create a Home Valuation Report for This Property
The Home Valuation Report is an in-depth analysis detailing your home's value as well as a comparison with similar homes in the area
Home Values in the Area
Average Home Value in this Area
Purchase History
| Date | Buyer | Sale Price | Title Company |
|---|---|---|---|
| Heiden John S | $465,000 | -- | |
| Pauly Joan M | -- | -- | |
| Pauly Frederick H | -- | -- | |
| Pauly Frederick H | -- | None Available | |
| Pauly Frederick H | $59,375 | Hanover Title Agency Inc |
Source: Public Records
Mortgage History
| Date | Status | Borrower | Loan Amount |
|---|---|---|---|
| Open | Heiden John S | $372,000 |
Source: Public Records
Tax History Compared to Growth
Tax History
| Year | Tax Paid | Tax Assessment Tax Assessment Total Assessment is a certain percentage of the fair market value that is determined by local assessors to be the total taxable value of land and additions on the property. | Land | Improvement |
|---|---|---|---|---|
| 2025 | $2,960 | $22,480 | $2,447 | $20,033 |
| 2024 | $2,960 | $22,480 | $2,447 | $20,033 |
| 2023 | $2,960 | $22,480 | $2,447 | $20,033 |
| 2022 | $2,647 | $19,548 | $2,000 | $17,548 |
| 2021 | $2,647 | $19,548 | $2,000 | $17,548 |
| 2020 | $2,604 | $19,548 | $2,000 | $17,548 |
| 2019 | $2,596 | $19,548 | $2,000 | $17,548 |
| 2018 | $2,470 | $19,548 | $2,000 | $17,548 |
| 2017 | $2,297 | $18,584 | $2,000 | $16,584 |
| 2016 | $9,787 | $27,876 | $3,000 | $24,876 |
| 2015 | $2,425 | $18,584 | $2,000 | $16,584 |
| 2014 | $2,577 | $19,644 | $2,000 | $17,644 |
Source: Public Records
Map
Nearby Homes
- 749 W Tara Ln
- 251 River Falls Dr
- 122 River Ridge Dr
- 111 River Ridge Dr
- 372 Old South Rd
- 5728 Reidville Rd
- 431 Whispering Ridge Trail
- 201 Glen Crest Dr
- 397 Tournament Point
- 750 Charleston Place
- 542 Drayton Hall Blvd
- 977 Jade Way
- 801 Sweetwater Hills Dr
- 805 Sweetwater Hills Dr
- 267 Santa Ana Way
- 990 Jade Way
- 845 Sweetwater Springs Dr
- Hudson Plan at Linden Park
- York Plan at Linden Park
- Palladio Ranch Plan at Linden Park
- 729 W Tara Ln
- 737 W Tara Ln
- 732 W Tara Ln
- 725 W Tara Ln
- 736 W Tara Ln
- 741 W Tara Ln
- 728 W Tara Ln
- 740 W Tara Ln
- 508 River Crest Dr
- 724 W Tara Ln
- 721 W Tara Ln
- 745 W Tara Ln
- 406 Masters Point
- 406 Masters Pointe
- 405 Masters Point
- 720 W Tara Ln
- 402 Masters Point
- 509 River Crest Dr
- 286 River Falls Dr
- 290 River Falls Dr