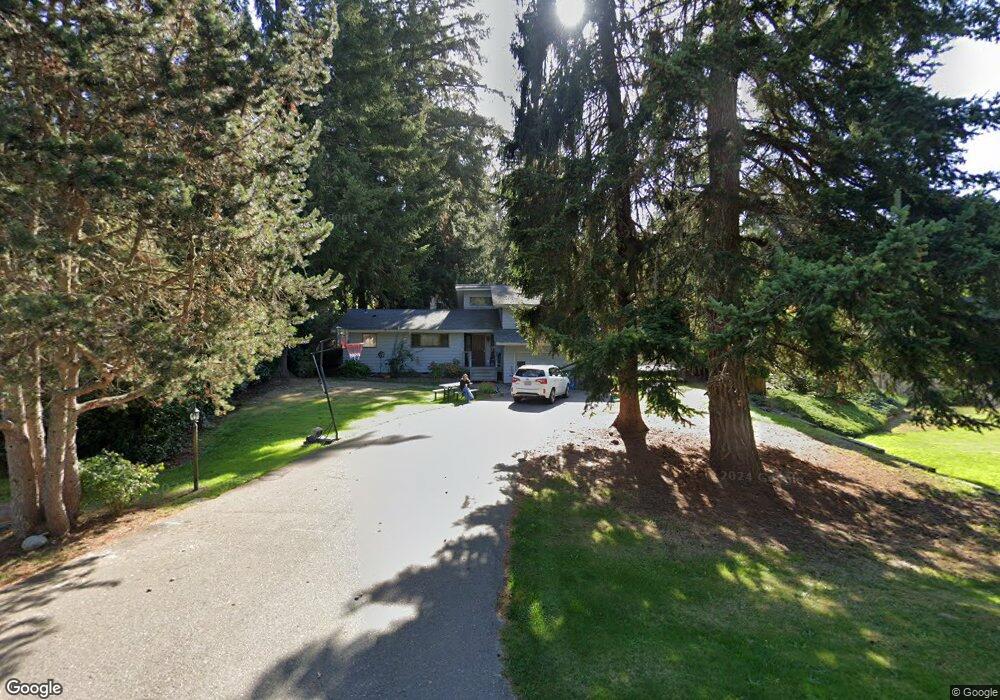
7330 Lazy s Ln NE Bremerton, WA 98311
Estimated Value: $491,242 - $547,000
3
Beds
2
Baths
1,520
Sq Ft
$343/Sq Ft
Est. Value
About This Home
This home is located at 7330 Lazy s Ln NE, Bremerton, WA 98311 and is currently estimated at $522,061, approximately $343 per square foot. 7330 Lazy s Ln NE is a home located in Kitsap County with nearby schools including Esquire Hills Elementary School, Fairview Middle School, and Olympic High School.
Ownership History
Date
Name
Owned For
Owner Type
Purchase Details
Closed on
Feb 27, 2008
Sold by
Bingham Danielle K
Bought by
Bingham Daniel T
Current Estimated Value
Home Financials for this Owner
Home Financials are based on the most recent Mortgage that was taken out on this home.
Original Mortgage
$176,200
Outstanding Balance
$109,180
Interest Rate
5.64%
Mortgage Type
Purchase Money Mortgage
Estimated Equity
$412,881
Purchase Details
Closed on
May 5, 1999
Sold by
Bank Of America Illinois
Bought by
Pingham Daniel T
Home Financials for this Owner
Home Financials are based on the most recent Mortgage that was taken out on this home.
Original Mortgage
$108,600
Interest Rate
6.94%
Purchase Details
Closed on
Dec 7, 1998
Sold by
Beaman Patricia Jane and Muzzana Patricia J
Bought by
Continental Bank National Assn
Create a Home Valuation Report for This Property
The Home Valuation Report is an in-depth analysis detailing your home's value as well as a comparison with similar homes in the area
Home Values in the Area
Average Home Value in this Area
Purchase History
| Date | Buyer | Sale Price | Title Company |
|---|---|---|---|
| Bingham Daniel T | -- | Land Title Company | |
| Pingham Daniel T | $97,000 | Land Title Company | |
| Continental Bank National Assn | $114,004 | Transnation Title Ins Co |
Source: Public Records
Mortgage History
| Date | Status | Borrower | Loan Amount |
|---|---|---|---|
| Open | Bingham Daniel T | $176,200 | |
| Closed | Pingham Daniel T | $108,600 |
Source: Public Records
Tax History Compared to Growth
Tax History
| Year | Tax Paid | Tax Assessment Tax Assessment Total Assessment is a certain percentage of the fair market value that is determined by local assessors to be the total taxable value of land and additions on the property. | Land | Improvement |
|---|---|---|---|---|
| 2026 | $4,040 | $426,220 | $107,350 | $318,870 |
| 2025 | $4,040 | $426,220 | $107,350 | $318,870 |
| 2024 | $3,928 | $425,990 | $107,350 | $318,640 |
| 2023 | $3,941 | $425,990 | $107,350 | $318,640 |
| 2022 | $3,711 | $353,120 | $88,720 | $264,400 |
| 2021 | $3,789 | $343,660 | $65,510 | $278,150 |
| 2020 | $3,540 | $324,680 | $61,810 | $262,870 |
| 2019 | $3,300 | $292,710 | $55,820 | $236,890 |
| 2018 | $3,534 | $243,280 | $46,130 | $197,150 |
| 2017 | $3,141 | $243,280 | $46,130 | $197,150 |
| 2016 | $3,051 | $218,470 | $41,190 | $177,280 |
| 2015 | $2,765 | $206,260 | $45,630 | $160,630 |
| 2014 | -- | $196,650 | $45,630 | $151,020 |
| 2013 | -- | $196,650 | $45,630 | $151,020 |
Source: Public Records
Map
Nearby Homes
- 7265 Thasos Ave NE
- 7726 Lazy s Ln NE
- 7020 Saint Charles Ln NE
- 7655 Forest Ridge Dr NE
- 0 Kaster Dr NE
- 3924 McCormick Village Dr Unit 25
- 2112 NE Lexington Dr
- 2940 Osiris Ct NE
- 3000 NE Loyola St
- 8065 Autumn Hills Place NE
- 2348 NE Windsor Ct
- 6522 State Hwy 303 NE
- 9422 Fairhaven Cir NE
- 3060 NE Mcwilliams Rd Unit 104
- 3060 NE Mcwilliams Rd Unit 124
- 3060 NE Mcwilliams Rd Unit 9
- 1858 NE Mcwilliams Rd
- 8259 Kaster Dr NE
- 7761 Beacon Place NE Unit 103
- 7529 Bridge Place NE
- 7318 Lazy s Ln NE
- 7348 Lazy s Ln NE
- 2362 NE Meadowlark Cir
- 2358 NE Meadowlark Cir
- 7354 Lazy s Ln NE
- 2374 NE Meadowlark Cir
- 7325 Lazy s Ln NE
- 7304 Lazy s Ln NE
- 7375 Lazy s Ln NE
- 7374 Lazy s Ln NE
- 7297 Pheasant Cir NE
- 2339 NE Meadowlark Cir
- 7379 Haynes Ln NE
- 2375 NE Meadowlark Cir
- 2365 NE Meadowlark Cir
- 7373 Haynes Ln NE
- 2317 NE Meadowlark Cir
- 7417 Lazy s Ln NE
- 7293 Pheasant Cir NE
- 7392 Lazy s Ln NE